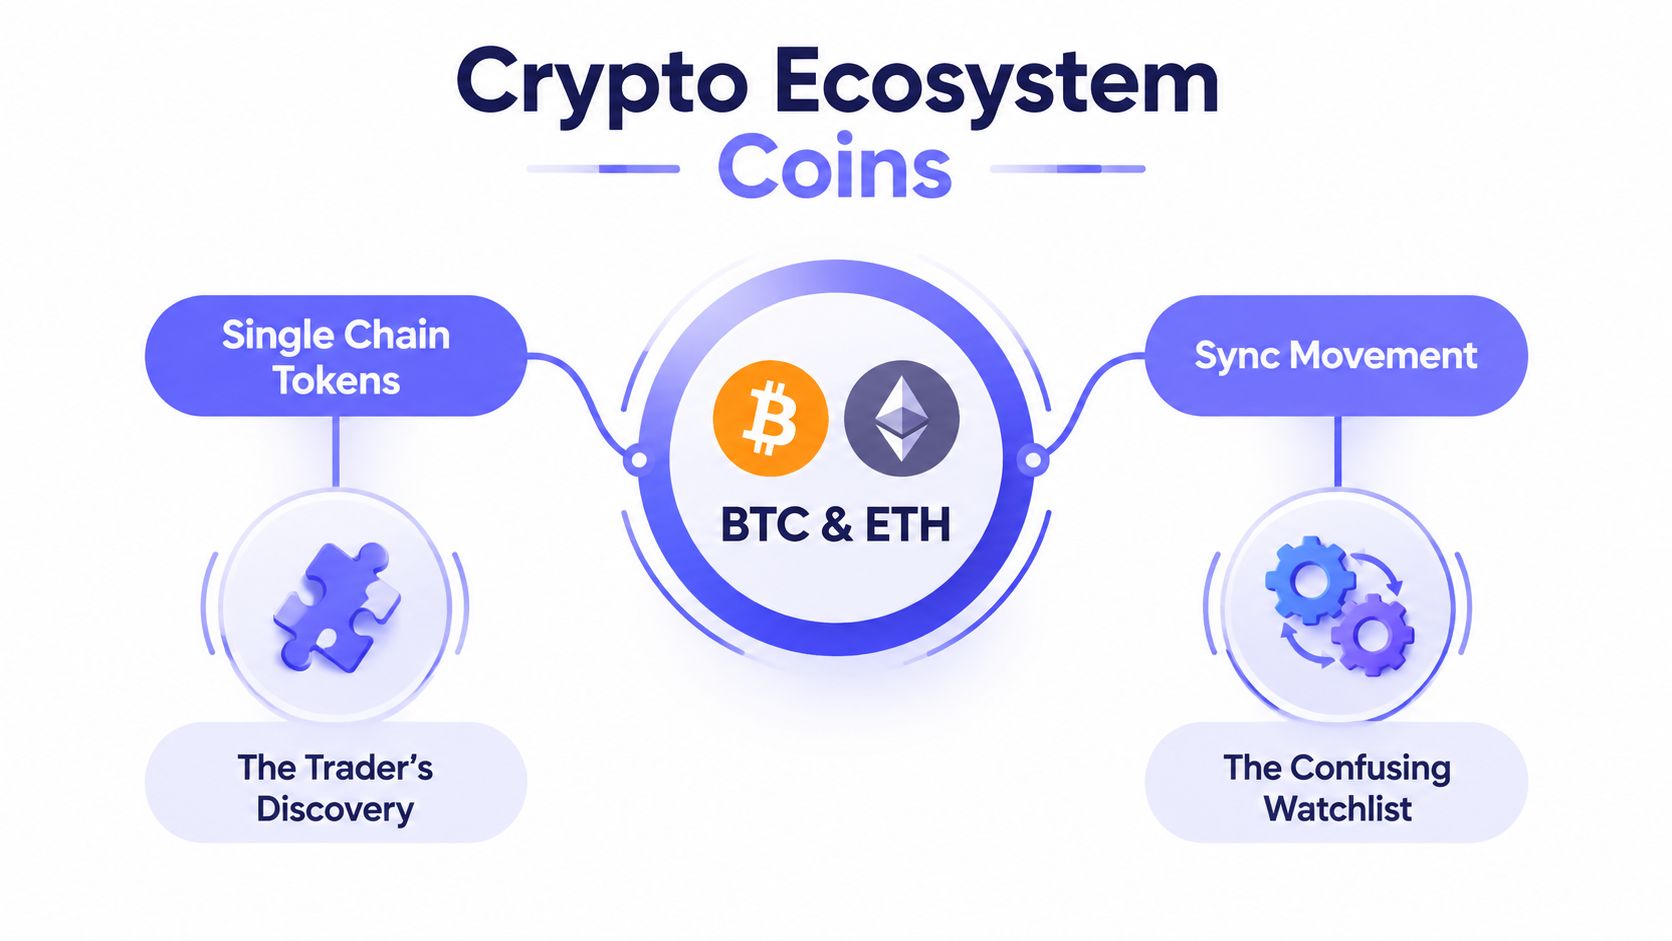
A trader who already follows BTC and ETH often notices the same pattern: several smaller tokens begin moving together whenever one blockchain attracts liquidity, users, or a new narrative. The first attempt to track that move usually produces a messy list of native assets, application tokens, wrapped coins, memes, and unrelated altcoins. Without a clear grouping rule, the watchlist says little about what the trader is monitoring.
Crypto ecosystem coins solve that classification problem when the label is used carefully. They're tokens whose economic relevance is tied primarily to a specific blockchain, rollup, or application network. The useful question isn't which chain a token can technically reach. It's whether the token shares a settlement layer, user base, liquidity environment, or chain-specific catalyst with the rest of the basket.
The market context makes this segmentation important. Ecosystem tokens trade inside a market still anchored by the largest cryptoassets and stablecoins, not in isolation.
Table of Contents
- What Crypto Ecosystem Coins Actually Are
- How Blockchain Ecosystems Differ in Structure
- How Ecosystem Baskets Are Organized and Compared
- Market Cap Versus TVL as Ecosystem Lenses
- A Worked Example Using a Base-Style Ecosystem
- Building Ecosystem Watchlists for TradingView
- Practical Checklist and Key Takeaways
What Crypto Ecosystem Coins Actually Are
A practical definition starts with the network, not the ticker. If a token's main economic role depends on one blockchain's execution, users, applications, or liquidity, it can reasonably belong to that ecosystem's coin universe. The group may include the gas token, native assets issued on the chain, application and governance tokens, liquid staking assets, ecosystem-aligned stablecoins, and highly local meme tokens.
That definition separates ecosystem coins from generic altcoins. A token doesn't become an ecosystem coin merely because it appears on a chain or has a popular community there. The label becomes useful when three conditions overlap:
Shared settlement layer: The token's activity settles on, or depends materially on, the same blockchain or rollup.
Concentrated users and liquidity: Traders, protocols, bridges, and applications create a recognizable local market.
Chain-specific catalysts: Upgrades, incentive programs, bridge events, fee changes, or application launches can affect several assets at once.
A token can satisfy one condition without satisfying the others. A widely bridged asset may have deep liquidity across many networks but remain a poor representative of any single ecosystem. Conversely, a small application token may have a strong connection to one chain while lacking enough liquidity to belong in a practical trading basket.
The useful boundary
The crypto market has become highly fragmented by token count. A 2026 industry summary citing Dune Analytics reported 84,473,791 cryptocurrencies across the blockchain ecosystem in July 2026, as described in the YieldFund token-count summary. That count makes an informal “everything on the chain” list nearly useless for research.
Because token count alone says little about relevance, a watchlist should document why each asset belongs rather than treating every token as an equal expression of network activity.
How Blockchain Ecosystems Differ in Structure
Two ecosystems can contain similar token labels while behaving very differently. The first distinction is architectural. A monolithic Layer 1 handles consensus, execution, and settlement within one network. An optimistic Layer 2 rollup executes transactions away from the base layer while relying on a settlement relationship with that layer. An app-chain dedicates much of its design to a specific application or narrowly defined use case.
Those choices determine the size and shape of an ecosystem basket. A general-purpose Layer 1 can support many independent decentralized applications, each with its own token and liquidity venues. A rollup may have fewer independent assets, but a denser relationship among its bridge assets, application tokens, and native gas economics. An app-chain may offer a smaller token surface with more direct exposure to one product's usage.
| Dimension | Monolithic L1 | Optimistic L2 Rollup | App-Chain |
|---|---|---|---|
| Settlement | Network settles its own transactions | Relies on a base-layer settlement relationship | Usually optimized around its application or domain |
| Gas economics | Native gas token generally anchors fees | May use a local gas asset while inheriting broader settlement constraints | Gas design can be tightly linked to application activity |
| Token surface | Broad, with many application and infrastructure assets | Often narrower, with bridge and ecosystem-aligned assets | Usually focused on the application and connected services |
| Watchlist design | Segment by protocol, category, and market-cap tier | Separate native, bridged, and application assets | Focus on the application, supporting infrastructure, and liquidity |
| Correlation risk | More varied across unrelated applications | Often stronger during chain-specific events | Can be concentrated around one usage driver |
Gas, fees, and execution
The native gas token deserves its own classification because it often combines several roles. Users may need it to pay transaction fees, validators or stakers may use it to secure the network, and market participants may treat it as the clearest liquid expression of chain demand. Application tokens have different economics, even when their applications generate substantial activity.
Fee markets also affect how analysts interpret a basket. A token linked to protocol revenue, a token used only for governance, and a token that pays network fees shouldn't be grouped as if they capture value in the same way. A rollup can also introduce sequencer economics and settlement costs that make its activity profile different from that of a standalone Layer 1.
Practical rule: classify the gas token, application tokens, bridge assets, and governance tokens separately before combining them into one ecosystem watchlist.
Finally, use case matters. A general-purpose ecosystem may need infrastructure, lending, trading, gaming, social, and meme segments. A DeFi-focused ecosystem has a narrower but more financially intensive application mix. A gaming or social network may generate meaningful user activity without producing TVL that resembles a lending-heavy chain. That difference becomes important when comparing market capitalization with on-chain liquidity.
How Ecosystem Baskets Are Organized and Compared
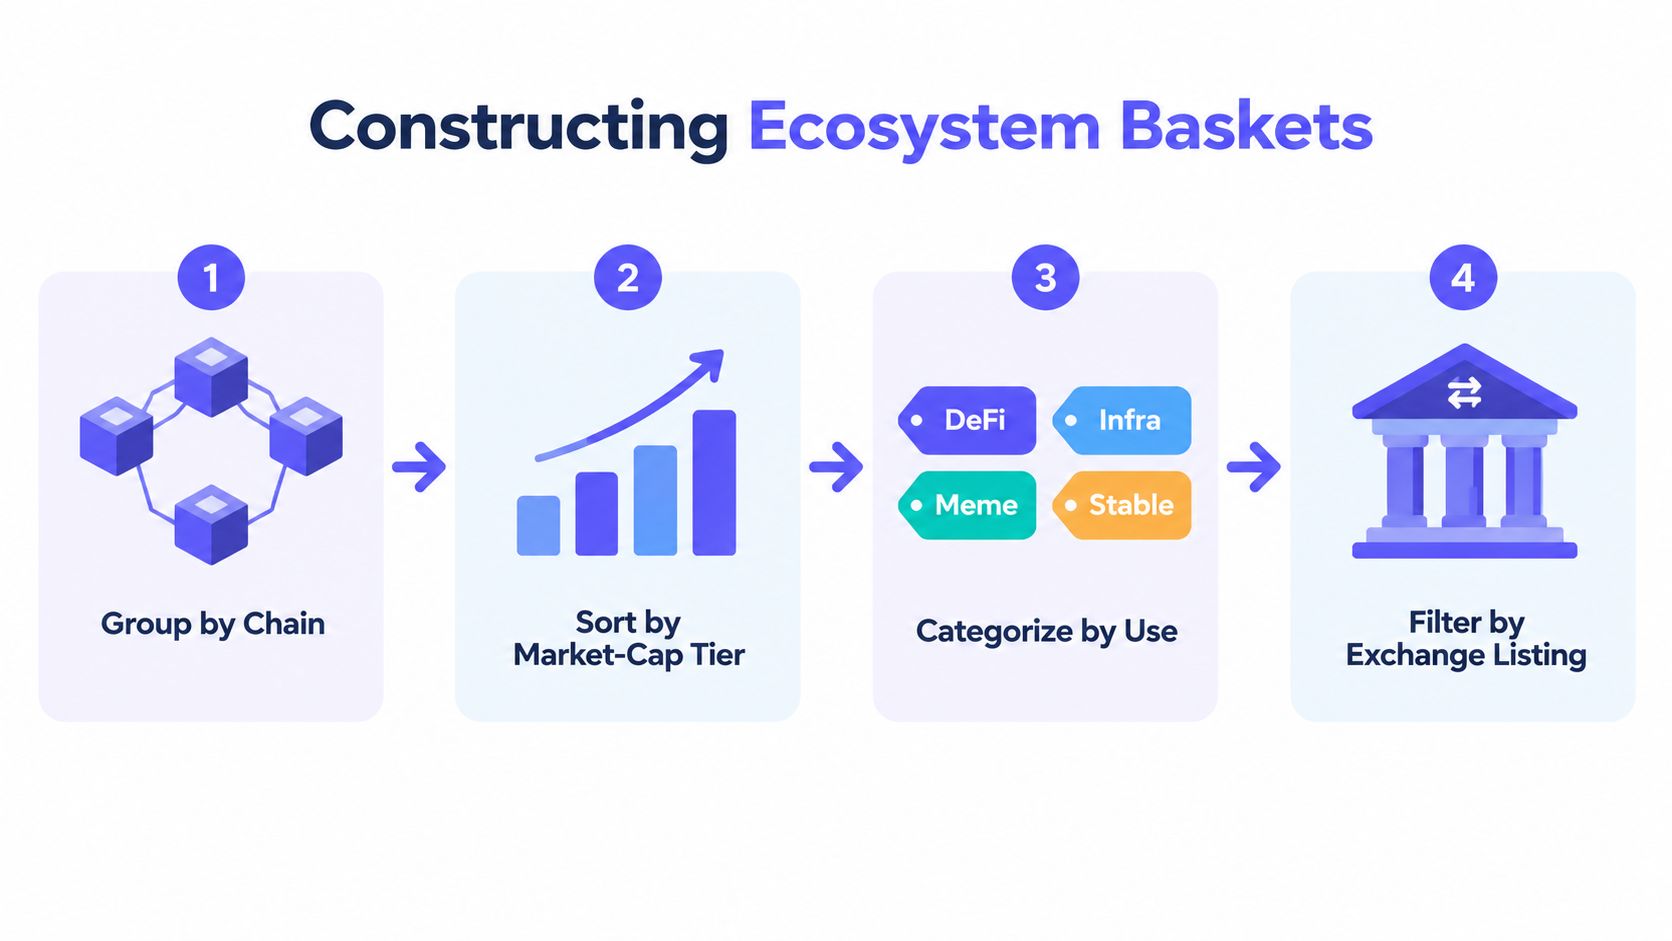
Ecosystem baskets are constructed by applying a rule to a defined network universe. The most common rules are chain, market-cap tier, category, and exchange availability. Each rule answers a different research question, so two valid baskets can contain very different symbols from the same ecosystem.
Published category directories illustrate the scale of this classification system. One index reports 267 distinct ecosystems and sector categories, including Ethereum Ecosystem with 249 coins, BNB Chain Ecosystem with 146 coins, Solana Ecosystem with 117 coins, and Base Ecosystem with 85 coins, according to CoinYQ's category index. These counts are directory classifications, not a guarantee that every listed asset has equal economic relevance or trading utility.
One chain, four baskets
A Base-style ecosystem shows why the construction rule matters. The network can be treated as one broad universe, then narrowed into several distinct lists:
Core market-cap basket: Keep the largest, most liquid ecosystem-linked assets available in the selected data universe. This creates a practical proxy for broad network exposure, but it may overrepresent assets that are easy to trade rather than assets with the strongest usage.
DeFi basket: Select decentralized-exchange, lending, derivatives, liquid staking, and related protocol tokens. This focuses the list on financial applications, although it can become sensitive to liquidity migration and protocol-specific events.
Meme basket: Isolate meme tokens associated with the chain. This creates a narrative and retail-attention basket, but its behavior may diverge sharply from infrastructure or application assets.
Exchange-access basket: Restrict the universe to tokens listed on selected centralized exchanges. This improves venue-specific execution planning and makes TradingView symbol mapping easier, but it excludes assets that matter onchain but lack the chosen exchange listing.
The resulting lists differ in correlation, liquidity, and symbol quality. A broad chain basket may track ecosystem beta. A meme basket may track attention. A centralized-exchange basket may track what a particular venue makes accessible.
Audit before import
The main operational risk is duplicate representation. A token can appear in native form, wrapped form, and bridged form, while a market-data directory may classify each version differently. The list should flag whether an entry is native, wrapped, or bridged before the analyst treats it as an independent exposure.
A practical market heat map workflow can then separate broad ecosystem movement from category-specific movement. The key is to preserve the construction rule in the watchlist name or notes, such as “Base, core market cap” or “Base, DeFi, centralized exchange listings.” Without that label, later comparisons become difficult to reproduce.
Market Cap Versus TVL as Ecosystem Lenses
Market capitalization and total value locked measure different things. Market cap estimates the aggregate valuation of tokens assigned to an ecosystem, while TVL measures capital deployed in protocols within that ecosystem. CryptoRank defines an ecosystem card's market cap as the total market value of assets belonging to projects in that ecosystem, as described on its ecosystem explorer.
Market cap is usually the cleaner starting point for a TradingView watchlist because it aligns with tradable token symbols and ranking workflows. It tends to emphasize liquid assets and can combine gas, governance, utility, and application tokens into one total. That makes it useful for sizing a basket, but it can hide whether the underlying protocols hold significant onchain capital.
TVL answers a narrower usage question. It's especially informative for lending, liquidity, staking, and other DeFi protocols that place capital into smart contracts. It's less conclusive for consumer applications, gaming, payments, or rollups whose economic importance may not appear as deposited collateral.
| Lens | What It Measures | Best For | Blind Spot |
|---|---|---|---|
| Market cap | Aggregate token valuation | Ranking assets and sizing tradable universes | Can include speculative or governance value |
| TVL | Capital deployed in ecosystem protocols | Evaluating DeFi usage and liquidity | May understate consumer or infrastructure activity |
| Market cap divided by TVL | Relative valuation against deployed capital | Quick comparative screening | Not a complete valuation model |
Reading the divergence
A high market cap paired with weak TVL can indicate that token valuation has moved ahead of current DeFi deployment. It doesn't prove that the ecosystem is overvalued, because consumer activity, payments, infrastructure, and future expectations may sit outside TVL. It does signal that the market-cap basket and the usage basket are telling different stories.
Strong TVL with a comparatively modest token market cap can indicate active protocol usage, a governance-token discount, or capital that hasn't translated into token demand. That interpretation also requires caution. TVL can include assets whose value changes with the market, and it can rise through incentives without producing durable user demand.
A market-cap list describes what the market values. A TVL list describes where capital is deployed. Neither metric replaces the other.
The best workflow places both lenses side by side. First, rank the ecosystem by market cap to define a manageable tradable universe. Then compare TVL, protocol composition, and liquidity venues. The market-cap-to-TVL relationship works as a screening signal, not a standalone investment conclusion. It helps identify where token valuation appears disconnected from visible protocol capital, which is precisely the kind of divergence a researcher can investigate further.
A Worked Example Using a Base-Style Ecosystem
A Base-style basket should begin with an explicit boundary: assets associated with the Base network, rather than every token that happens to be transferable there. A live Base Ecosystem listing from CryptoSlate illustrates how a market-data page can size a selected ecosystem basket by market capitalization, asset count, and 24-hour volume. Another directory, CoinMarketCap, organizes Base assets “in size by market capitalization” on its Base Ecosystem category page, reinforcing the importance of documenting the source's inclusion rule.
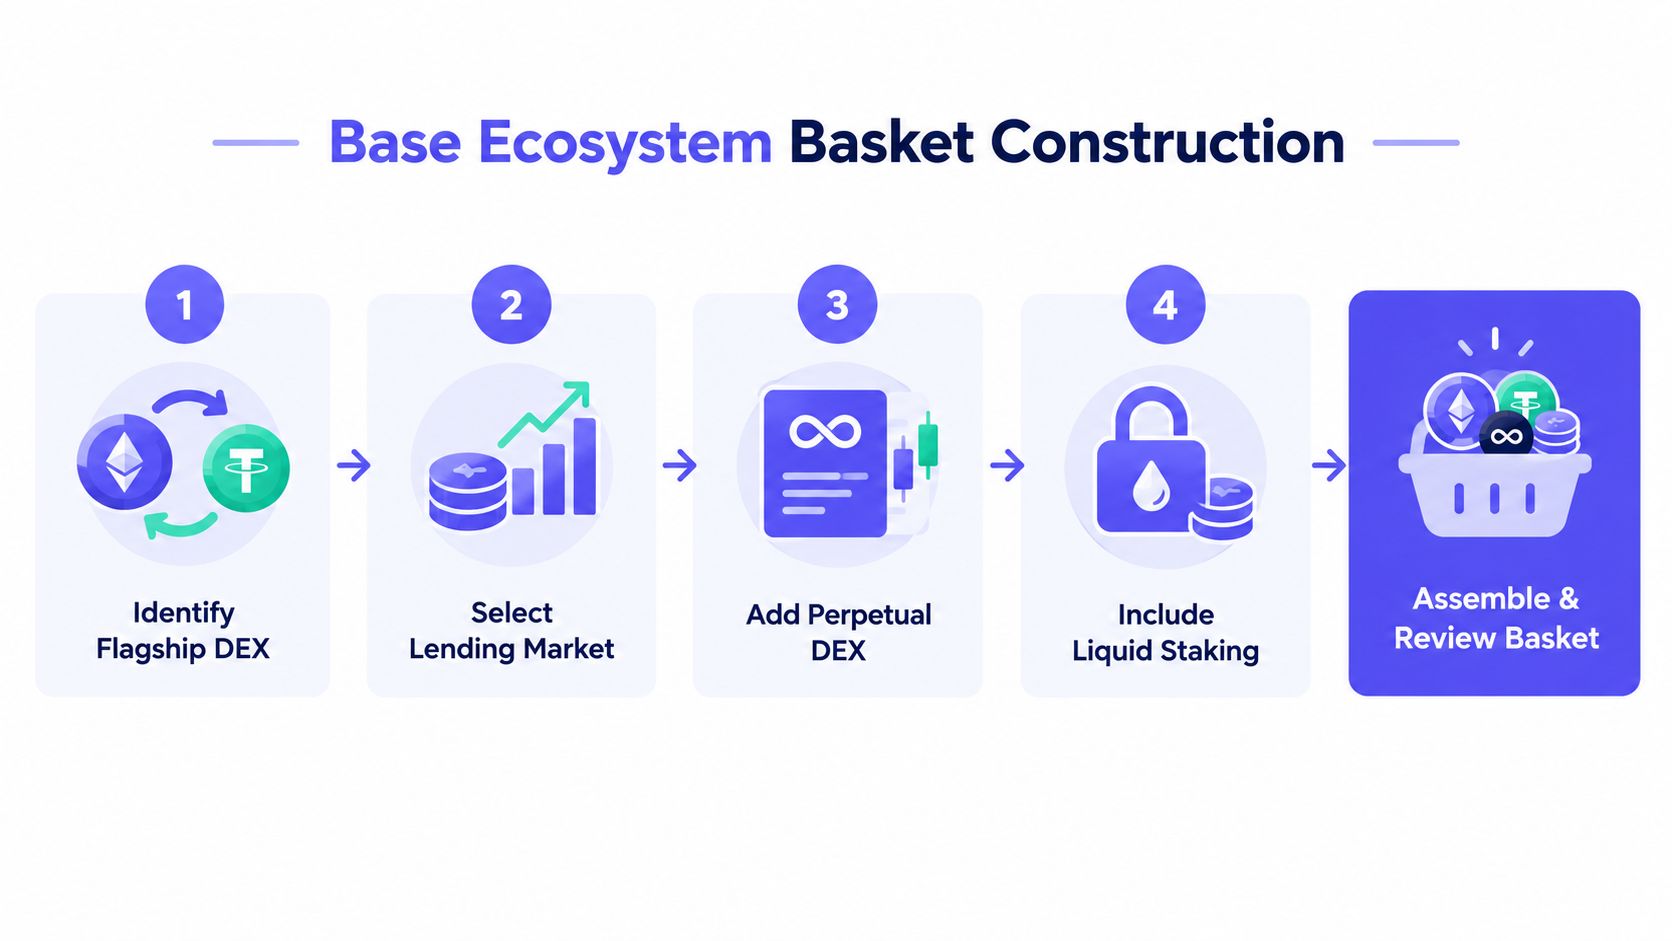
The protocol map should cover distinct functions rather than collecting names randomly:
Flagship DEX: Identify the principal spot-trading venue associated with the chain.
Lending market: Add the main borrowing and lending primitive, if the ecosystem has one.
Perpetual DEX: Separate derivatives exposure from spot and lending exposure.
Liquid staking or restaking: Track assets that represent staked or delegated capital.
Meme sector: Include a separate narrative sleeve instead of mixing it invisibly into the core list.
Stablecoin or bridge asset: Flag settlement and representation differences before inclusion.
Normalize the TradingView symbols
A generic ticker isn't a complete TradingView symbol. The venue prefix identifies the exchange or data source, so COINBASE:BRETT and KRAKEN:BRETT can represent different chart feeds, volume histories, and trading access. A bridged asset such as WETH also shouldn't be treated as identical to native ETH without recording the representation and venue.
The correct order of operations is:
Define the Base boundary.
List protocols by function.
Pull the canonical ticker for each asset.
Add the exchange prefix in
EXCHANGE:PAIRformat.Deduplicate by prefix and asset identity.
Apply a market-cap or liquidity threshold to keep the basket usable.
A Base-specific chain-token guide can continue the research process, but the construction logic transfers directly to Solana, Sui, and Arbitrum. The chain changes, the protocol map changes, and the available venues change. The audit sequence stays the same.
Building Ecosystem Watchlists for TradingView
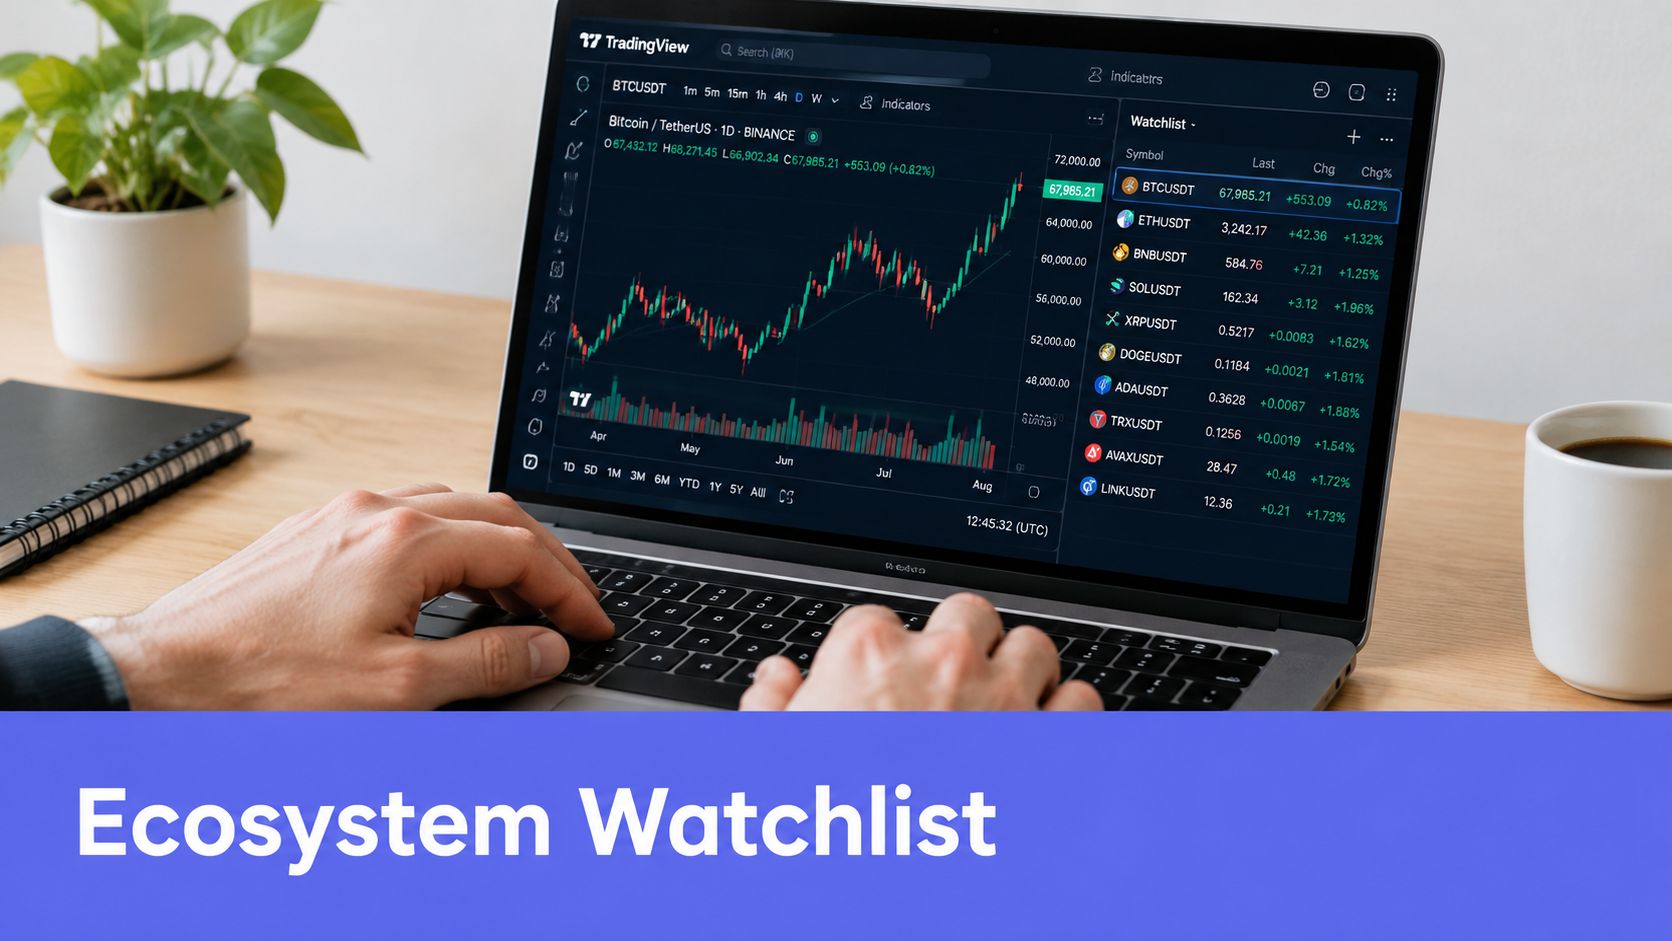
TradingView can handle an ecosystem watchlist manually. A trader can combine exchange-prefixed symbols, add a description that identifies the chain or category, and arrange the list for chart review. That approach works well for a small basket. It becomes harder to maintain when the list expands, crosses several exchanges, or needs repeated filtering by market cap and TVL.
The important distinction is between charting and symbol-universe management. TradingView supplies the charts, alerts, layouts, and manual watchlist environment. A workflow utility can help define which symbols belong in the list, normalize their formatting, and prepare an importable configuration. It shouldn't be treated as a replacement for TradingView, a signal engine, or a source of predictions.
A repeatable maintenance loop
A practical process starts with a maintained ecosystem universe, then narrows it according to the research question. TradingList offers TradingView-compatible watchlists organized by centralized exchange, market capitalization, supported category, and ecosystem. Its relevant product surfaces include standard watchlists, custom crypto watchlists created from supported ecosystem or market-cap filters, ScreenerList for market-filtered symbol lists, DeltaList for comparing a reference list with exchange or market variants, and FusionList for combining several watchlists into one exportable configuration.
That workflow addresses the manual symbol-hunting problem without implying official TradingView integration or a trading outcome. The service uses a daily refresh cycle when supported source data is available, so users still need to audit listings, prefixes, and classification decisions.
A watchlist also needs a maintenance policy:
Monthly ranking: Re-rank the core basket by the chosen market-cap lens.
Volume review: Prune symbols whose accessible trading activity has dried up.
New-asset review: Evaluate new entrants within a week of their token generation event, rather than adding them automatically.
Prefix audit: Confirm that each symbol still points to the intended venue and pair.
A TradingView screener watchlist workflow is most useful when the analyst treats the exported list as a research input. The list should remain documented, venue-specific, and aligned with the basket's stated purpose.
Practical Checklist and Key Takeaways
A useful ecosystem watchlist begins with a written rule. The rule can be simple, but it must state which chain or rollup defines the boundary, which asset types qualify, and whether the list measures valuation, usage, category momentum, or exchange access.
Pre-build checklist
Define the boundary: State whether the universe includes only native projects, bridged assets, application tokens, memes, stablecoins, or all supported ecosystem classifications.
Choose the ranking lens: Use market cap for a tradable valuation universe, TVL for deployed protocol capital, or both when the research question involves valuation versus usage.
Normalize symbols: Record the exchange prefix, pair, native or wrapped status, and intended data venue for every TradingView symbol.
Set inclusion thresholds: Decide how the basket handles low-liquidity assets, new listings, delistings, and tokens without a suitable centralized-exchange feed.
Document categories: Keep core, DeFi, infrastructure, meme, stablecoin, and derivatives exposures distinguishable.
Schedule audits: Review the list on a recurring basis and perform a deeper quarterly audit of classifications, prefixes, and dead tickers.
The central lesson is that ecosystem baskets only improve on ad-hoc altcoin lists when their construction rules are documented and enforced. A chain grouping answers where the asset belongs. A market-cap filter answers how large the tradable universe is. TVL answers where capital is deployed. Category and exchange filters answer what type of activity the trader can isolate and where that activity can be observed.
Market-cap and TVL shouldn't be treated as interchangeable health scores. A market-cap list can contain governance and speculative value, while TVL can miss consumer, payments, and infrastructure activity. TradingView symbols also require periodic auditing because a ticker without the correct exchange prefix can point to the wrong venue or fail to represent the asset the analyst intended to monitor.
Maintenance should follow the ecosystem's pace. A monthly ranking pass keeps the basket aligned with its stated size lens, while a quarterly review should check whether chains have merged, protocols have rebranded, assets have migrated, or venues have changed their symbols. The watchlist remains useful when every inclusion has a reason and every symbol has an identifiable market source.
TradingList provides maintained, TradingView-compatible watchlists organized by supported centralized exchange, market capitalization, category, and blockchain ecosystem, along with tools for creating, comparing, filtering, and combining symbol lists. Traders and researchers building Base, Solana, Sui, Arbitrum, or other supported ecosystem baskets can use TradingList to start with a structured universe and continue auditing prefixes, categories, and inclusion rules before importing it into TradingView.