
A high short ratio, usually expressed as days to cover, compares equity short interest with average daily trading volume. A separate measure, short interest as a percentage of float, compares shares sold short with tradable float. Rules of thumb such as 5 to 7 days to cover or more than 10% of float describe different equity metrics, not interchangeable crypto thresholds. In plain terms, a high reading can point to crowded bearish positioning, but its meaning depends on the metric, market structure, and data source.
Crypto researchers encounter related questions when a perpetual market looks heavily leaned to one side, funding turns negative, and the asset starts showing signs of forced unwinding. That's why understanding what the equity short-interest ratio measures—and what it does not measure in crypto matters, even for traders who spend more time in charts than in equity screeners.
Table of Contents
- Why Crypto Traders Care About the High Short Ratio
- How a High Short Ratio Is Calculated
- Common Thresholds and What They Signal
- Why High Ratios Can Be Misleading
- Applying the Short Ratio Lens to Crypto Markets
- Organizing a Manual Short-Ratio Review With TradingView Watchlists
- Quick Reference Checklist for High Short Ratio
Why Crypto Traders Care About the High Short Ratio
A trader watching a crypto perpetual futures chart often sees the same setup repeat, negative funding, aggressive short positioning, and a market that suddenly stops going down. That's the moment a high short ratio becomes useful as a sentiment lens, because it helps quantify how crowded the bearish side may be.
The term comes from equities. Part of its logic can inform crypto research, but the underlying metrics do not transfer directly. Market references define the short-interest ratio as short interest divided by average daily trading volume, also called days to cover. When that ratio gets high, it suggests the market could need several sessions of normal volume for shorts to unwind, which is why bearish sentiment and squeeze risk can rise together in the same name. Investopedia
Why the metric resonates in crypto
Crypto traders already think in terms of positioning, liquidity, and forced covering. A coin with strong downtrend momentum can still become volatile if too many traders are leaning short and liquidity thins out, because the same bearish consensus that looks comfortable on a screen can become fragile when price starts moving against it.
That's the attraction of the short-ratio idea. It gives traders a simple way to ask whether the market is merely pessimistic, or whether it's crowded. In equities, that distinction can matter a lot, and the same mindset helps in crypto when traders compare spot behavior, perpetual futures structure, and the quality of the order flow.
Practical rule: A high short ratio is not a prediction. It's a context signal that says bearish positioning may be stretched enough to deserve closer review.
For crypto researchers and educators, the value is even broader. The metric becomes a shared vocabulary for discussing why an asset feels vulnerable to a squeeze, why volume matters more than raw short interest, and why a thin market can look more extreme than a liquid one at the same short exposure. That framing helps traders avoid reducing every negative setup to a simple “too many shorts” story.
How a High Short Ratio Is Calculated

Days to cover, the most common version
The most common calculation is days to cover. It uses a simple formula, short interest divided by average daily trading volume. If a stock has 10 million shares sold short and average daily volume of 2 million, the ratio is 5. That means it would take five trading days to buy back the shares if volume stayed near normal levels.
That result turns a raw position size into a time estimate. A trader does not just see that short interest exists, they see how long it might take for shorts to cover if buyers step in and volume stays steady. In liquid markets, that context matters because the denominator can shift quickly.
Short interest as a percentage of float
A related but distinct measure is short interest as a percentage of float. The logic is direct: shares sold short divided by the float available for trading. Some market education sources treat above 10% as fairly high and above 20% as extremely high.
The two formulas answer different questions. Days to cover asks how long it might take to unwind shorts under normal volume. Percent of float asks how much of the tradable supply is already sold short. That difference matters because a low-float asset can look extreme even when the absolute short position is not huge.
A small worked example
Take a stock with 5 million shares sold short, 50 million shares of float, and average daily volume of 1 million shares. Days to cover equals 5, and short interest as a percentage of float equals 10%. The same position size can therefore look moderate on one lens and high on the other. Traders need to check both the denominator and the unit before they draw a conclusion.
For crypto traders, this is the part that keeps the metric useful. The inputs have to be clear, the lens has to match the question, and the reading has to fit the market being studied. A short ratio is only as clean as the data behind it, and that is why traders often organize names into TradingView watchlists before comparing them side by side.
Common Thresholds and What They Signal
Working the thresholds into a usable scale
Definitions vary, but some educational sources place 5 to 7 days to cover in the high zone, while above 10 days is described as extreme pessimism. Greater Trading These are equity-market rules of thumb, not crypto thresholds.
The float-based version uses similar tiers. Several market sources treat above 10% of float as high, above 20% as extremely high, and some describe 30% or more as rare. Power Cycle Trading Those tiers do not guarantee anything on their own, but they help a trader label the backdrop more precisely.
| Metric | Reading | Typical Interpretation |
|---|---|---|
| Days to cover | 5 to 7 | Commonly treated as high |
| Days to cover | Above 10 | Often described as extreme |
| Short interest as % of float | Above 10% | Fairly high |
| Short interest as % of float | Above 20% | Extremely high |
What those labels really mean
The label is only the first layer. A high reading points to bearish consensus, but it also raises the chance that shorts become forced buyers if price starts moving against them. That is why short ratios keep coming up in discussions of reversals and squeeze risk.
The threshold is a starting point, not a verdict.
For crypto traders, the useful habit is to treat these tiers as orientation markers. A name in the high zone deserves more attention than a name below it, but the trader still has to check liquidity, market structure, and the source of the short exposure before assigning meaning to the number. That is easier to do when the symbols are grouped in a clean TradingView watchlist workflow for crypto ticker symbols, so the same threshold can be compared across several markets without losing track of the context.
Why High Ratios Can Be Misleading

The ratio can rise for two different reasons
A high short ratio does not automatically mean a strong short-squeeze candidate. It can rise because more shares are sold short, or because average daily volume falls, or because both happen together. TradeZero
That distinction is the core trap. Traders often look at the final number and assume it reflects crowded short positioning alone, but the denominator matters just as much. If liquidity dries up, the ratio can jump mechanically even when the underlying short exposure hasn't changed much.
A useful analogy is a checkout lane. If more people enter the queue, the line gets longer. If the store closes most registers, the line can get longer for the same number of people. The short ratio behaves the same way, a longer line can reflect more short sellers, less trading volume, or both.
Why liquidity changes the meaning
The same short interest can look much higher when trading volume is thin. That's why a ratio that seems extreme in one asset may be ordinary in another, especially across markets with very different liquidity profiles. In a highly liquid market, the same short position can be easier to unwind than in a thin one.
This is also why readers should separate true crowded short positioning from illiquidity-driven high ratio before treating the signal as meaningful. If the number is high because volume has fallen, the ratio says as much about market inactivity as it does about bearish conviction.
TradingView symbol formatting and exchange prefixes matter here because traders often compare assets across venues and need a clean way to see whether a move in the ratio is tied to the venue, the pair, or the broader market setup.
Analytical rule: A high ratio is more informative when the reader knows whether the crowd grew larger, or the room got smaller.
Applying the Short Ratio Lens to Crypto Markets
Mapping the equities idea into crypto
Crypto does not offer a universal equivalent to the equity short-interest ratio. Open interest counts outstanding derivatives contracts and is not a directional measure of short interest; each open contract has both a long and a short side. Funding rates, venue-specific long/short ratios when published, borrow activity, spot and perpetual volume, and liquidity can provide complementary context, but none recreates the equity formula on its own.
These indicators are venue-specific proxies, not interchangeable inputs. Funding rates, borrow rates, and exchange reporting cadence all shape how visible short exposure really is. In practice, a crypto researcher needs several data points, not a single ratio, to assess whether bearish positioning is building or only looks noisy on one venue.
Why the equity thresholds are only orientation
Equity benchmarks can provide background, but they are conventions rather than universal cutoffs. Some educational sources place 5 to 7 days to cover in the high zone and readings above 10 days in an extreme zone. Greater Trading These ranges describe equities and should not be copied into crypto as hard thresholds.
Crypto traders can borrow that mental scale, but they should not copy it as a hard cutoff. A coin with heavy perpetual positioning and thin spot liquidity may behave differently from a large-cap asset with deep order books. The same number can mean different things depending on how centralized the activity is and how quickly volume shifts across venues. A thinly traded token can make the ratio look stretched even when the short book is not especially crowded, while a liquid blue-chip pair can absorb similar positioning with less drama.
What to watch instead of a single figure
A practical crypto workflow looks at the shape of the market, not just the headline number.
- Funding and borrow context: Negative funding means shorts pay longs on that venue, but it does not quantify short interest on its own.
- Venue concentration: A crowded setup on one exchange may not look the same everywhere else.
- Liquidity quality: Thin volume can exaggerate the appearance of crowding.
- Supply availability: Supply and venue availability can shape liquidity, but neither is a direct substitute for equity float.
A clean watchlist workflow helps traders sort that context fast. Crypto screener logic for watchlist building fits naturally with this approach because the main task is to narrow a large universe into a smaller set of names where short positioning, liquidity, and venue structure deserve attention.
Organizing a Manual Short-Ratio Review With TradingView Watchlists
A cleaner way to organize the universe
A trader who wants to review short-positioning indicators across many symbols needs an organized universe. A TradingView watchlist does not calculate short interest, open interest, or funding; it groups symbols so those metrics can be checked manually in the appropriate market-data sources. TradingList fits as a workflow tool for building TradingView-compatible crypto watchlists.
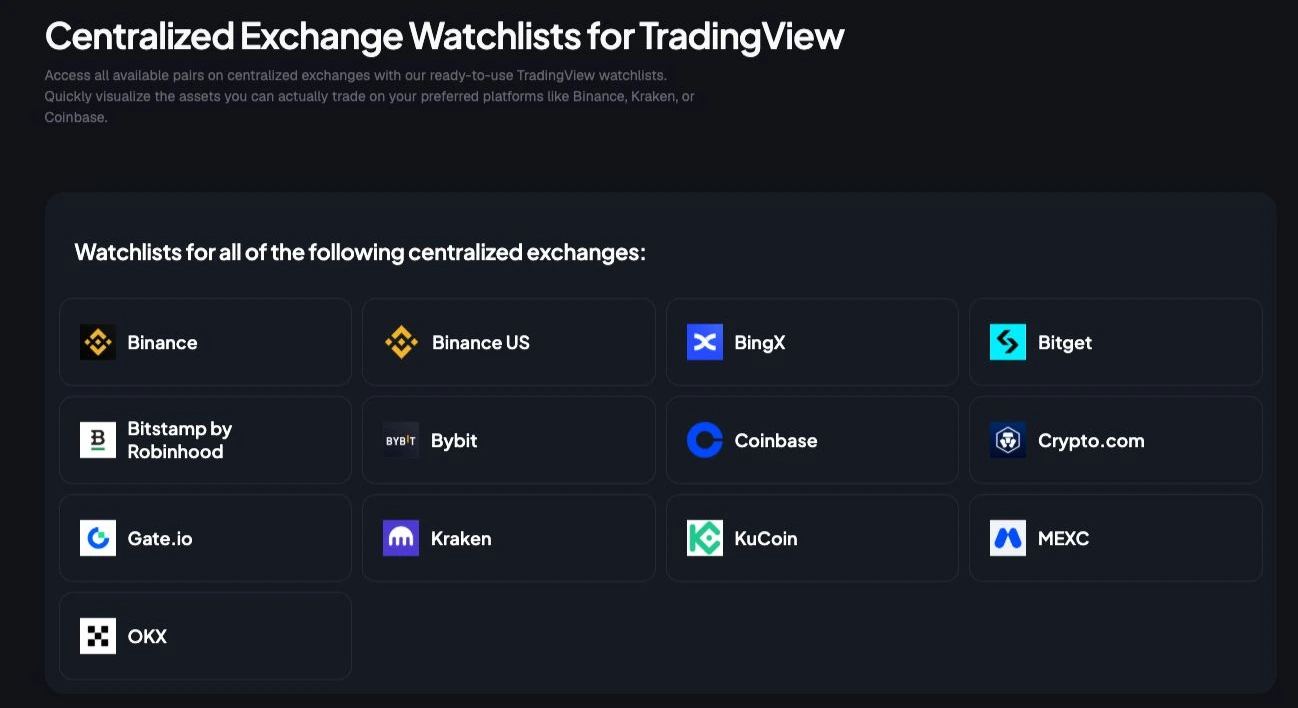
TradingList focuses on maintained lists organized by centralized exchange, market capitalization, supported category, and ecosystem. It also supports custom crypto watchlists, ScreenerList for building a symbol list from market filters, DeltaList for comparing a reference watchlist with exchange or market variants, and FusionList for combining several lists into one exportable configuration.
A practical workflow for short-ratio review
A useful setup starts with a standard exchange watchlist or a market-cap watchlist, then uses separate market-data sources to review positioning and liquidity for the relevant symbols. From there, a ScreenerList can reduce noise with market filters, DeltaList can show how a reference list differs from an exchange variant, and FusionList can merge several filtered lists into one file that's easier to import and maintain.
That matters because short-ratio work is usually comparative. A trader may want to know which symbols on a specific centralized venue deserve the most attention, which large-cap names sit in the same risk bucket, or which ecosystem list has the most concentrated setup. A clean list makes those comparisons faster and less error-prone than working from a scattered set of tickers.
TradingList isn't a signal engine or prediction tool. Its role is narrower and more practical, it helps traders and researchers organize, compare, combine, and export symbol universes that are compatible with TradingView. That makes it a fit for people who want structure around the scan, not a forecast from the scan itself.
TradingView screener watchlist workflows become easier to manage when the universe is already normalized and venue-aware.
Quick Reference Checklist for High Short Ratio

- Definition: Is the reading days to cover or short interest as a percentage of float?
- Days to Cover Formula: Is the short interest divided by average daily volume, so the result shows how many trading days it might take to cover?
- % of Float Formula: Is the short interest being compared with the tradable float, so the reader can judge crowding relative to supply?
- Threshold Tiers: Is the reading in the 5 to 7 days zone, above 10 days, or above 10% or 20% of float, and is the equity-only context stated?
- Illiquidity Caveat: Is the ratio high because short interest rose, or because volume fell?
- Crypto Mapping: Does the review treat open interest, funding, borrow activity, venue data, volume, and liquidity as complementary proxies rather than a direct short-interest ratio?
- Watchlist Workflow: Is the symbol universe organized cleanly enough in TradingView to compare venue-specific, market-cap, category, or ecosystem lists without manual cleanup?
A high short ratio is useful only after the trader asks what is driving it. If the number reflects real crowding, it can flag bearish consensus and squeeze risk. If it reflects thin volume, it may be mostly a liquidity story.
TradingList helps crypto traders organize TradingView-compatible watchlists by centralized exchange, market cap, supported category, and ecosystem, so manual short-ratio research starts with a cleaner symbol universe. It's built for filtering, comparing, combining, and exporting lists, which makes it easier to review crowded names without rebuilding every watchlist by hand. Visit TradingList to explore maintained crypto watchlists and build a more structured TradingView workflow.