
A crypto pair is pushing through a large green candle, and the immediate question is familiar: has the move run too far, or is momentum only getting started? The price pane rarely answers that question cleanly. A Commodity Channel Index, or CCI, sits below it, comparing the latest price behavior with its recent average and showing whether the move is unusually strong or weak.
That makes CCI useful beyond a single chart. A trader can inspect the indicator on one BTC/USDT chart, then scan a carefully defined crypto universe for symbols where momentum is expanding, fading, or staying close to neutral. The important distinction is that CCI identifies market conditions. It doesn't predict the next candle, provide a trade signal by itself, or turn an overbought reading into an automatic sell order.
Table of Contents
- What the Commodity Channel Index Actually Measures
- How the CCI Math Works in Plain English
- Reading the Plus 100 and Minus 100 Thresholds
- Applying CCI on a Crypto Chart in TradingView
- Scanning CCI Across a TradingView Crypto Watchlist
- Pairing CCI With One Complementary Indicator
- Common CCI Mistakes on Crypto Charts
- Putting CCI to Work on Your Watchlist
What the Commodity Channel Index Actually Measures
The Commodity Channel Index is a volatility-adjusted momentum oscillator. Donald Lambert developed it and first introduced it in 1980, originally in the October 1980 issue of Commodities magazine. Although the indicator was designed for commodity futures, later technical references describe its use across equities, currencies, and futures markets, while modern charting also applies it to crypto markets. A concise history of CCI and its original purpose places that launch date at the center of the indicator's development.
CCI compares a market's typical price with its moving average, then scales the difference by the market's recent average deviation. In plain English, it asks: How far is the current price behaving from what has recently been normal for this symbol and timeframe?
That question separates CCI from several familiar oscillators:
- CCI emphasizes deviation from a recent average. A high positive reading means typical price is materially above that average after adjustment for recent variation.
- RSI emphasizes relative gains and losses. Its reading describes the balance of recent upward and downward closes, rather than the distance between typical price and its own average.
- MACD emphasizes the relationship between moving averages. It focuses on the distance and direction of those averages, while CCI centers on price deviation and mean deviation.
- Stochastic compares the close with a recent high-low range. CCI uses high, low, and close together through typical price, then measures how unusual the result is against its recent distribution.
The same candle can therefore produce different messages across these indicators. RSI might show strong buying pressure, MACD might confirm an upward relationship between averages, and CCI might reveal that typical price has moved unusually far above its recent norm.
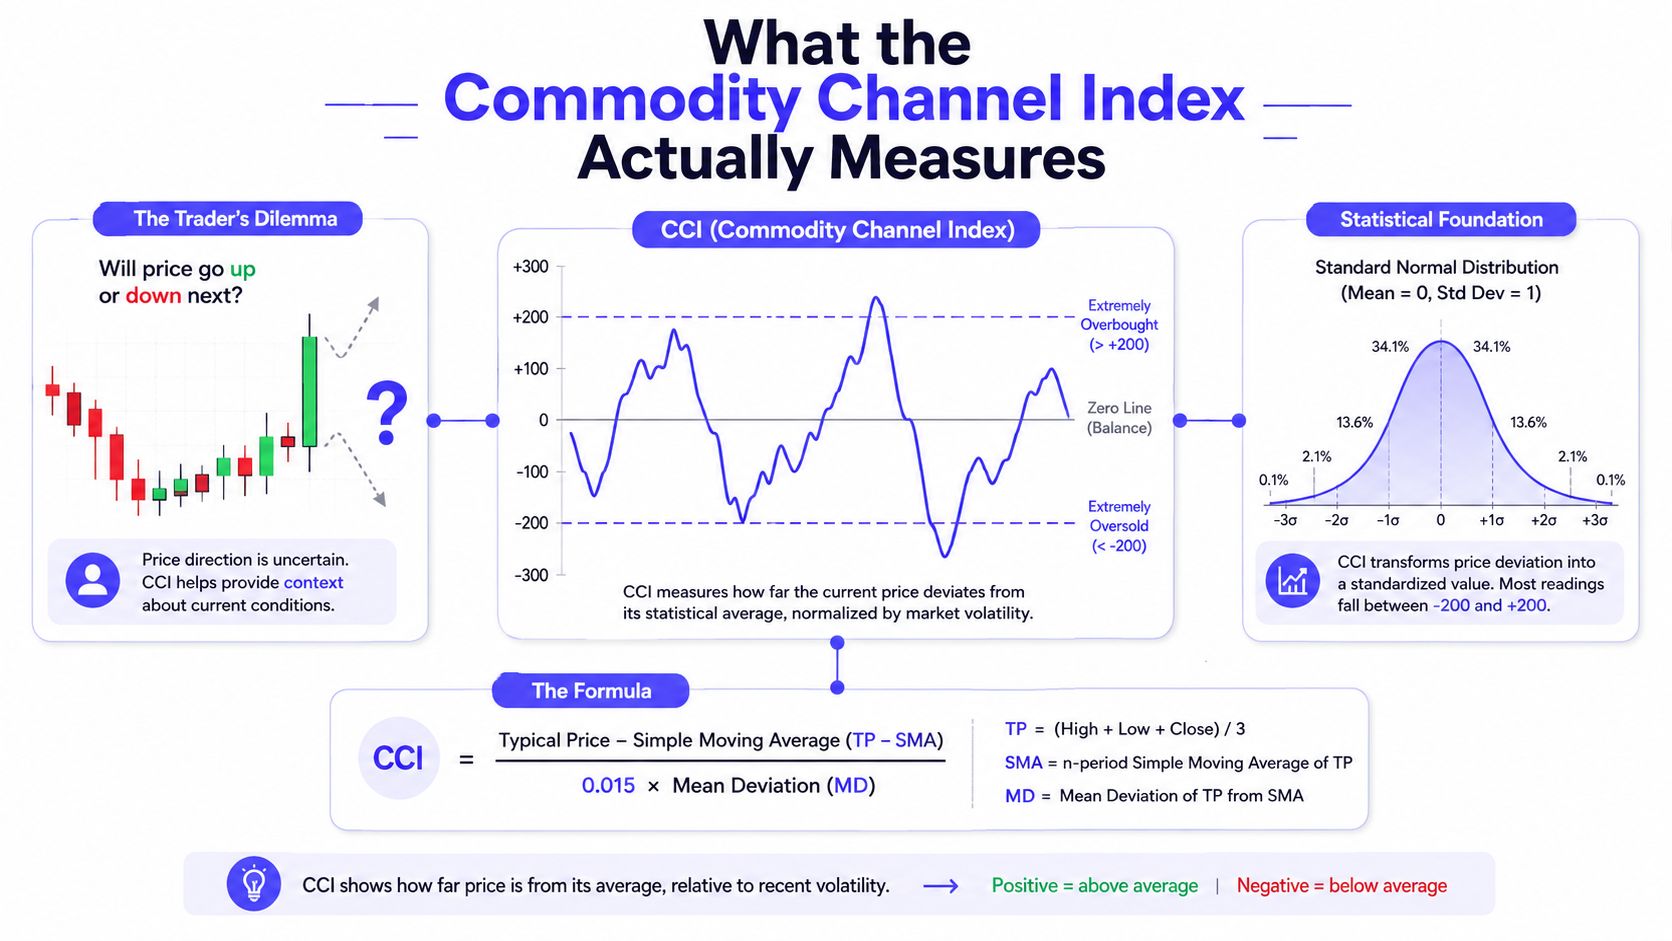
Plain-English definition: A CCI reading shows how unusually far a market's typical price has moved from its recent average, after adjustment for normal variation.
That definition also explains why CCI has no fixed upper or lower boundary. A market can keep moving farther from its recent average, especially during a strong trend. The familiar threshold lines help organize the chart, but they don't cap the indicator or guarantee a reversal.
How the CCI Math Works in Plain English
CCI's calculation answers a practical chart question: how far has the current typical price moved from its recent norm, after accounting for the market's usual variation? A common setting uses a 20-period lookback, and StockCharts' CCI calculation guide explains how the mean deviation is calculated.
Step 1: Find the typical price
For each candle, CCI combines the high, low, and close:
Typical Price = (High + Low + Close) ÷ 3
Suppose a BTC/USDT candle has a high of 102, a low of 96, and a close of 101. Its typical price is 99.67. Using all three values gives CCI a broader view of the candle than the close alone.
Step 2: Compare it with the recent average
CCI then calculates the 20-period simple moving average of typical price. If the latest typical price is 99.67 and the 20-period average is 98.67, the latest value is 1.00 unit above its recent typical level.
That difference needs context. A one-unit move may be large during a quiet period but ordinary during a volatile one.
Step 3: Measure normal deviation
For each of the 20 typical prices, the formula finds the distance from the 20-period average, ignores whether that distance is positive or negative, adds the results, and divides by 20. The result is the mean deviation, which describes how far typical prices usually sit from their average.
Assume the mean deviation is 0.444. The latest deviation, 1.00, is therefore more than twice the recent average deviation. CCI treats that wider separation as an unusually large move relative to the recent price behavior.
Step 4: Apply the scaling constant
The formula divides the latest deviation by 0.015 times mean deviation. Using the rough values above:
CCI ≈ 1.00 ÷ (0.015 × 0.444) ≈ +150
The arithmetic is rounded, so this example illustrates the process rather than reproducing a platform value exactly. A reading of +150 does not mean BTC rose by 150 units. It means the latest typical price is far above its moving average compared with the market's recent mean deviation.
Fidelity's technical indicator guide explains that Lambert selected the 0.015 constant so roughly 70% to 80% of readings would fall between -100 and +100. CQG's CCI documentation describes these levels as standardized reference points, not ordinary price support or resistance.
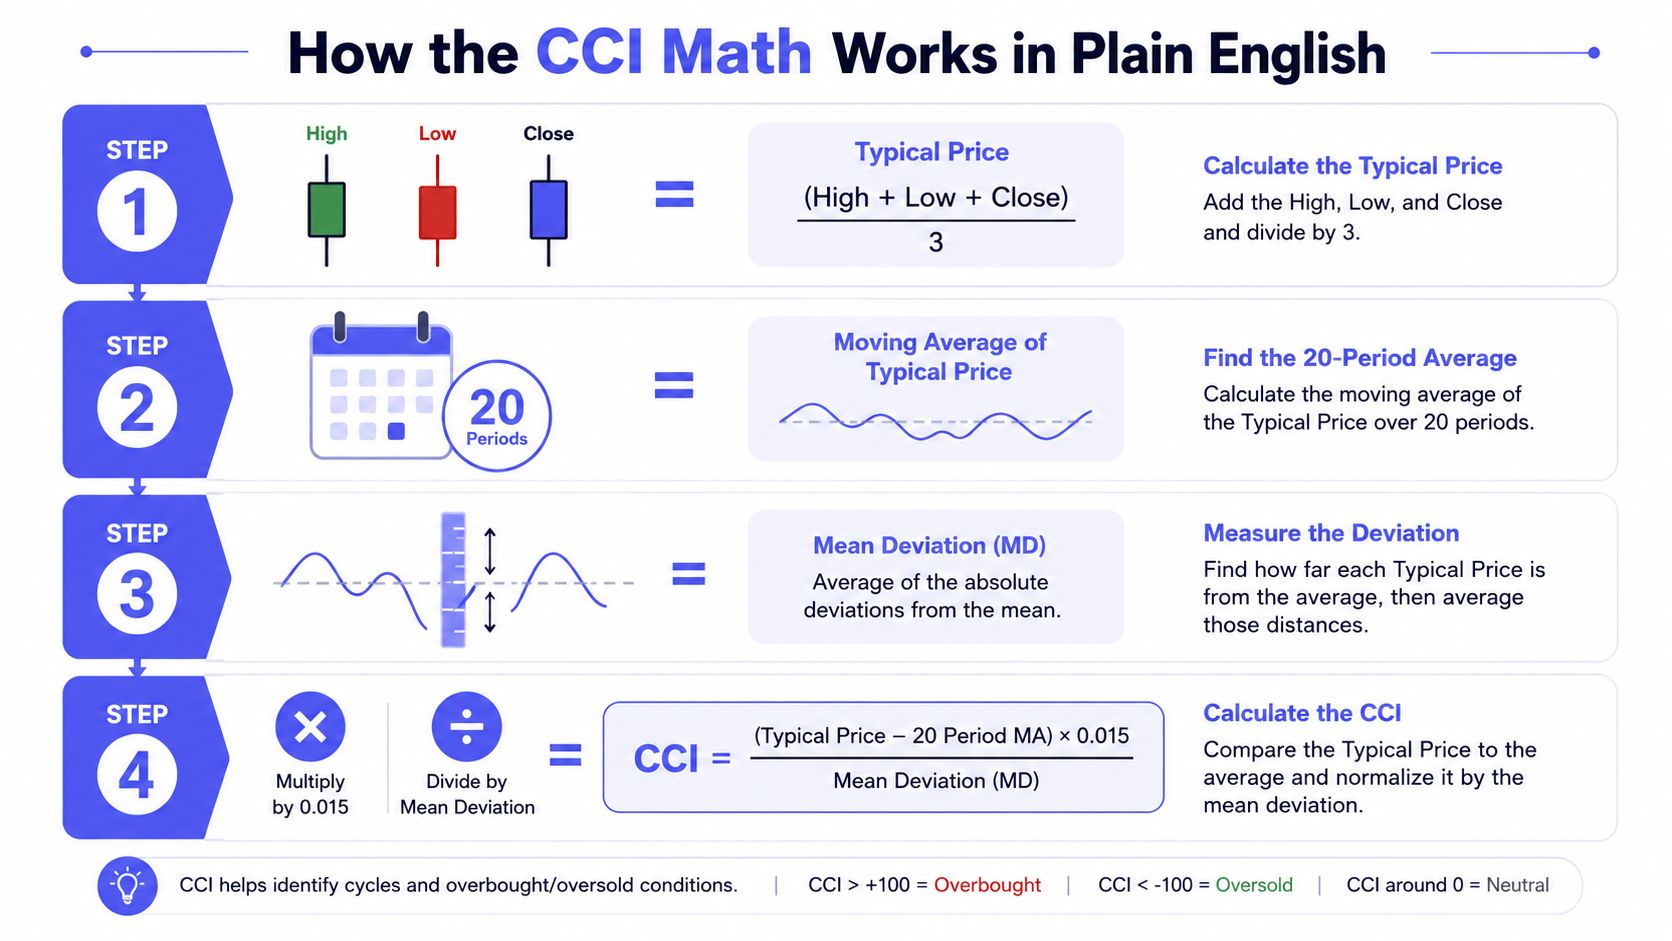
The lookback changes how quickly CCI reacts. A shorter setting uses fewer candles, so the moving average and deviation estimate respond faster and can produce a more erratic line. A longer setting smooths the context but may recognize a fresh momentum burst later. On a watchlist, that trade-off helps determine whether CCI is useful for broad scanning or better reserved for closer chart review.
Reading the Plus 100 and Minus 100 Thresholds
On a crypto pair that is trending higher, CCI can rise above +100 and stay there while price continues climbing. Here, “overbought” means that price has moved unusually far above its recent average. It does not prove that a decline must follow. A choppy altcoin may cross +100 briefly, then slip back below it because the move lacks sustained direction.
The +100 and -100 lines aren't price support or resistance. They sit in the oscillator pane as statistical reference levels created by CCI's scaling convention. Lambert selected 0.015 so most readings would fall within the central band, making comparisons across markets more usable. TradingMetrics' CCI reference also presents zero as a central interpretation point and ±100 as statistical boundaries, not fixed barriers in the market.
Four states deserve attention:
- Above +100 and holding: Momentum is unusually strong. Trend-following traders may read repeated values in this zone as persistent strength, while mean-reversion traders wait for momentum to weaken before considering a reversal.
- Below -100 and holding: Typical price is unusually weak compared with its recent average. That can support a bearish trend reading, but it does not guarantee an immediate bounce.
- Returning inside the band: A move from an extreme toward the central region suggests that the unusual displacement is fading. Price structure or volume can help determine whether that change is meaningful.
- Hugging zero: Price remains relatively close to its moving average after volatility adjustment. This usually provides less directional information than a sustained move away from zero.
The zero line is a neutral reference, not a signal. A cross above it means typical price has moved above its recent average. A cross below it means the opposite. The surrounding price action determines whether the shift matters.
| CCI Region | Typical Market Behavior | How Traders Use It |
|---|---|---|
| Above +100 | Strong upside displacement, sometimes persistent in a trend | Monitor momentum continuation and wait for evidence before assuming reversal |
| Between zero and +100 | Positive momentum without an extreme reading | Compare with price structure and a confirmation tool |
| Near zero | Price remains close to its recent average | Treat as a low-conviction condition unless structure provides context |
| Between -100 and zero | Negative momentum without an extreme reading | Watch whether weakness is expanding or stabilizing |
| Below -100 | Strong downside displacement, sometimes persistent in a downtrend | Monitor trend continuation or a possible mean-reversion setup after confirmation |
For watchlist scanning, the threshold is a filter rather than an automatic trade command. A coin moving above +100 may deserve a closer chart review for continuation, while one returning below -100 may need examination for persistent weakness. Compare the reading with the broader trend before acting. The farther CCI moves from zero, the more unusual recent price behavior has become, but unusual conditions can persist longer than a reversal trader expects.
Applying CCI on a Crypto Chart in TradingView
A live chart can show a familiar ticker while pulling prices from different venues. Start with the symbol, not the oscillator. BTCUSDT alone does not identify an exchange. A TradingView-compatible symbol such as BINANCE:BTCUSDT specifies the venue prefix and pair, so the CCI uses a defined market's price series.
Use this setup sequence:
- Open TradingView's symbol search and enter
BINANCE:BTCUSDT, or another supported venue-specific crypto symbol. - Open Indicators and search for Commodity Channel Index.
- Add the standard CCI study.
- Set the length to 20 periods, a commonly used lookback.
- Add guides at zero, +100, and -100 if the script does not display them clearly.
- Begin on a 4-hour chart, then switch timeframes to see how the same length changes the market window.
The CCI appears in a separate pane below price. On a 4-hour chart, each point reflects the current candle and the preceding candles included in the selected lookback. Change the timeframe, and the candle population changes too. A 20-period CCI on one timeframe therefore does not represent the same number of hours or days as a 20-period CCI on another.
For watchlist work, this setup is the starting filter. Scan for symbols whose CCI meets your condition, then open the individual charts to check trend, structure, liquidity, and volume. The oscillator narrows the list. It does not replace chart review.
Why the prefix matters
The exchange prefix determines the underlying highs, lows, closes, and price series used in the calculation. Two venues may print different candles for the same asset pair, particularly during fast crypto markets. A watchlist containing only generic tickers can therefore produce an ambiguous result when you repeat a scan.
For a closer explanation of exchange prefixes, pair names, and TradingView formatting, see this guide to crypto symbols in TradingView. Advanced users can inspect or modify Pine Script to change displayed levels or add a condition, but beginners can use the standard study without code. First confirm that the symbol and timeframe match the market question. Then treat the CCI reading as a prompt for investigation, not a trade command.
Scanning CCI Across a TradingView Crypto Watchlist
A single-chart CCI answers, “What is happening on this pair?” A watchlist scan answers, “Which pairs in a defined universe deserve attention?” That second question makes CCI more useful for research and routine market review, especially when a trader doesn't want to type symbols one by one.
The workflow begins with a curated symbol universe. A trader can organize the list by centralized exchange, market-cap tier, supported category, or ecosystem, then apply it to a TradingView-compatible screening workflow. The universe should be narrow enough to represent a clear research question. A scan across one centralized venue asks a different question from a scan across several market-cap groups.
A useful sequence is:
- Define the venue: Select a centralized exchange universe when venue-specific execution and chart consistency matter.
- Choose the grouping: Use a market-cap, category, or ecosystem list when the research question concerns a market segment rather than one exchange.
- Normalize the symbols: Confirm that each item includes the correct exchange prefix and pair format.
- Set the CCI condition: Look for a cross above +100, a move below -100, a return toward zero, or sustained readings on one side of the central line.
- Open the charts manually: Treat the scan as a shortlist, then inspect price structure, liquidity, volume, and the selected timeframe.
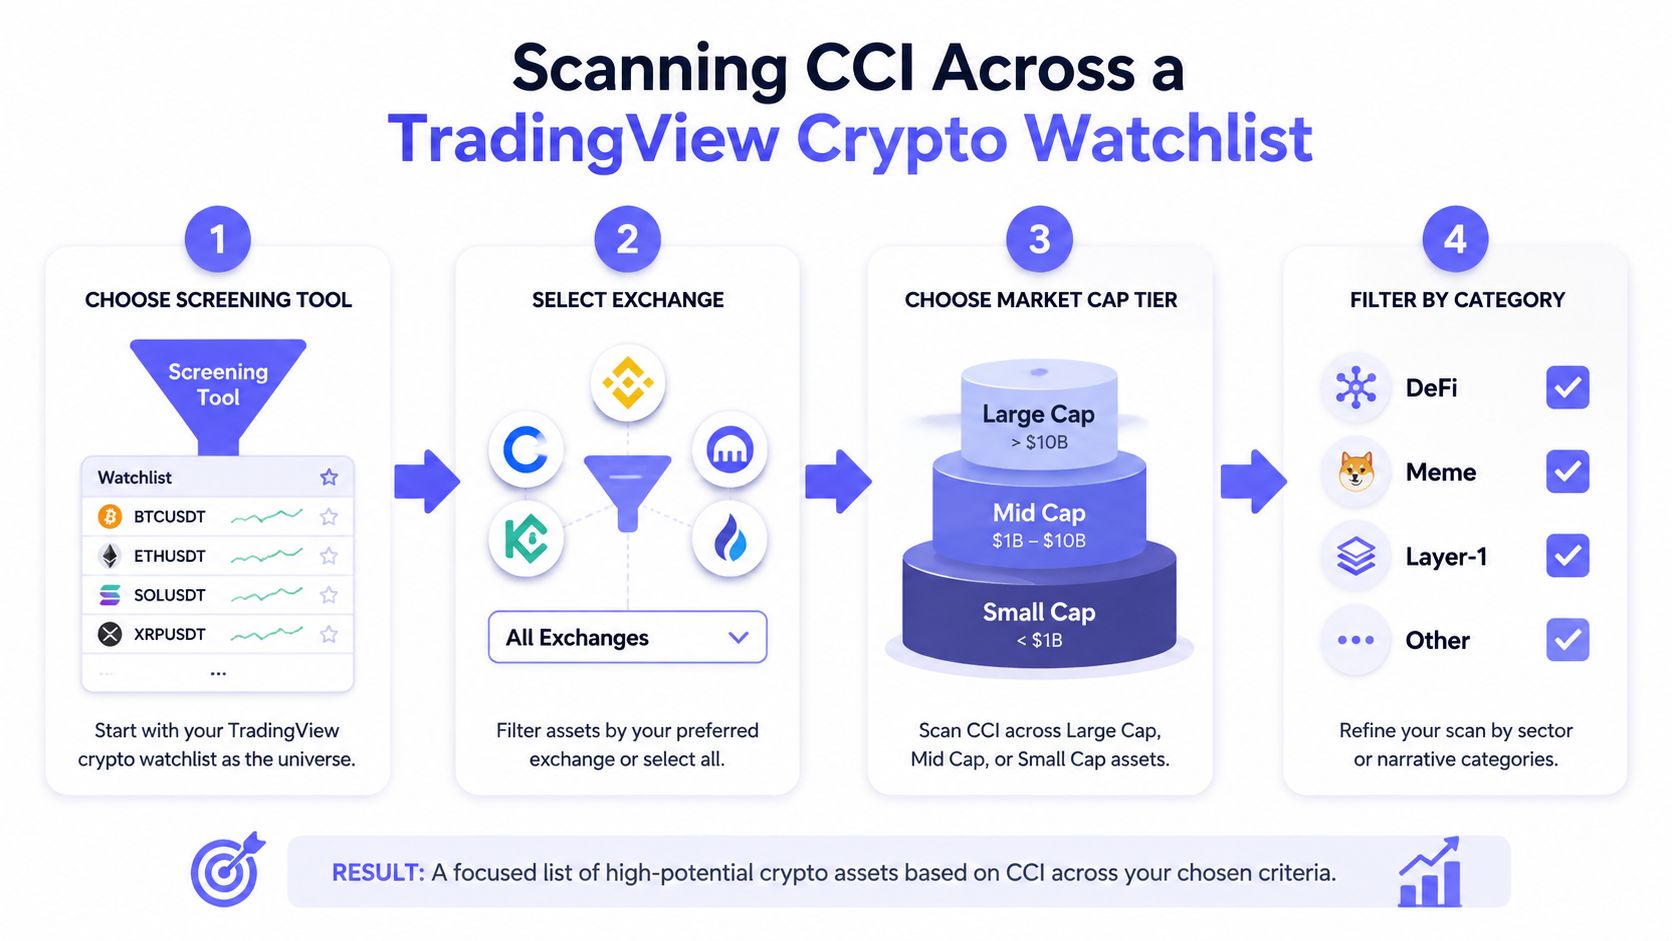
TradingView's crypto screener watchlist workflow becomes more manageable when the input list is prepared before the scan. Manually entering every symbol creates opportunities for wrong prefixes, stale names, duplicate assets, or accidental mixing of spot and derivative series. A maintained list doesn't validate the CCI signal, but it gives the screener a more deliberate universe.
Read the scan as a research queue
A result such as “CCI above +100” means only that the selected series is showing an unusually strong positive displacement under the chosen settings. It doesn't reveal whether the move is liquid, trend-supported, or already reversing. The chart review remains essential.
For 24/7 crypto markets, the timeframe decision matters particularly because candles continue forming outside traditional market sessions. A scan on a shorter timeframe can produce more changes than a scan on a higher timeframe, so researchers should record the timeframe, venue, CCI length, and condition each time they compare results. That record turns a casual list of extremes into a repeatable screening process.
Pairing CCI With One Complementary Indicator
CCI already measures deviation and momentum context. Adding another momentum oscillator that asks nearly the same question can make a chart look more convincing without adding much information. A cleaner pairing uses volume, because volume addresses participation rather than price displacement.
Consider two otherwise similar charts where CCI falls below -100. On the first, volume contracts as price weakens. The move may reflect limited participation or a thin order book, so the oversold-style reading deserves caution. On the second, CCI falls below -100 while volume expands. That combination shows unusually weak price behavior accompanied by greater activity, which can support the interpretation that sellers are more engaged.
The pairing works because each tool has a separate job:
- CCI: Measures how far typical price has moved from its recent average after volatility adjustment.
- Volume: Shows how much trading activity accompanied the move.
- Price structure: Determines whether the observation occurs at a meaningful high, low, range boundary, or breakout area.
Practical rule: CCI identifies the condition. Volume helps assess participation. Price structure decides whether the condition matters.
The confirmation doesn't need to become a complicated stack. A trader can define one rule, such as reviewing only CCI extremes that occur with expanding volume, then test that rule across the chosen symbol universe. Another trader may prefer to inspect whether volume confirms a breakout after CCI moves above +100. Neither approach is automatically superior.
Volume also has limitations. Exchange-specific data can differ, and a volume bar doesn't explain whether activity represents aggressive buying, selling, hedging, or position transfers. It should therefore filter attention, not replace chart reading. The benefit of this pairing is analytical separation, not a promise of more accurate entries or better performance.
Common CCI Mistakes on Crypto Charts
CCI produces poor decisions when traders treat its labels as instructions. Crypto's volatility and continuous trading structure make several shortcuts especially dangerous.
Mistake one, selling every overbought reading. A CCI line can stay above +100 while a strong uptrend continues. “Overbought” means price is unusually far above its recent average. It doesn't mean a sell signal has arrived.
Mistake two, ignoring the timeframe's meaning. Crypto trades around the clock, so a candle represents a continuous slice of activity rather than a traditional session close. A 20-period calculation on a 4-hour chart and a 20-period calculation on a shorter chart describe different market windows. The setting should match the research question.
Mistake three, applying CCI to an illiquid pair without checking the data. Sparse trades and abrupt prints can distort highs, lows, closes, and mean deviation. An extreme reading may describe a poor price series rather than a meaningful market imbalance.
Mistake four, watching only ±100. The zero line often gives earlier context about whether typical price is above or below its recent average. A trader who waits for a dramatic threshold may overlook a gradual momentum shift or mistake a brief threshold excursion for a durable trend.
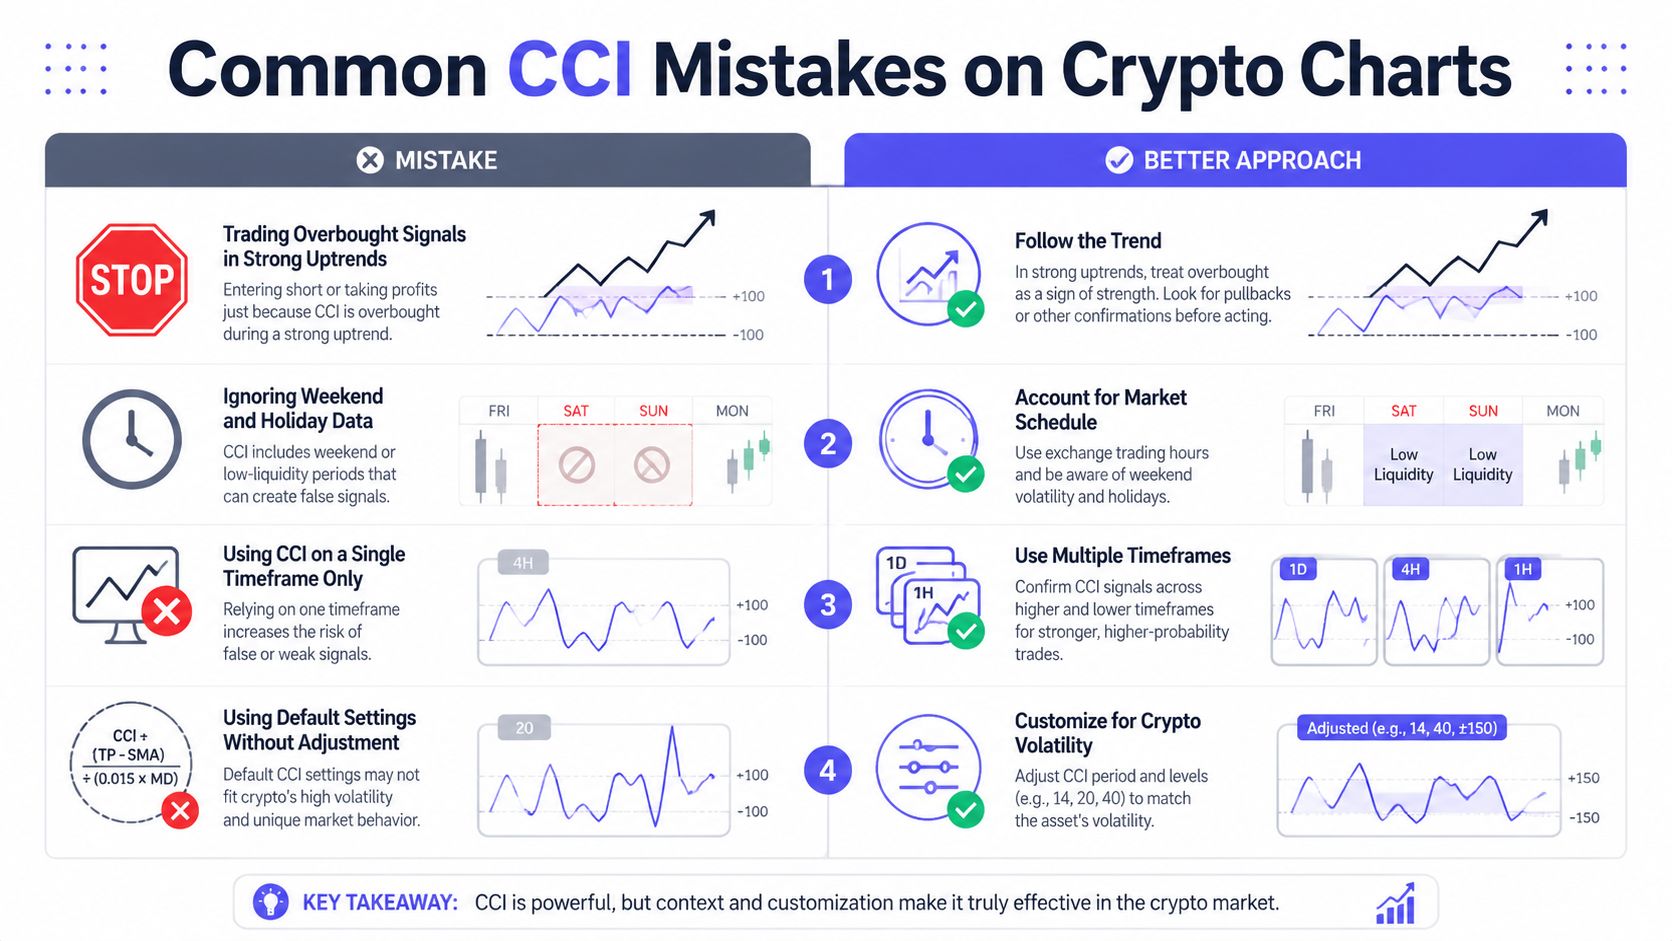
Do: Record the venue, timeframe, length, CCI state, volume context, and price structure.
Don't: Treat one threshold crossing as a complete trade thesis.
A further problem appears when traders change settings after every disappointing signal. A shorter length may make the line more reactive, while a longer length may smooth it, but neither choice removes market noise. Consistency matters if a researcher wants to compare scans or evaluate a rule over time. CCI remains a context tool, not a substitute for liquidity checks, risk controls, or a defined market hypothesis.
Putting CCI to Work on Your Watchlist
A workable CCI routine can fit on one page. The following checklist keeps the indicator attached to a repeatable watchlist process instead of turning it into a collection of dramatic chart screenshots.
- Confirm the symbol: Use a venue-specific TradingView format such as
BINANCE:BTCUSDT, and verify that the pair represents the intended market. - Set the baseline: Start with a 20-period CCI, then keep the setting stable while comparing symbols or timeframes.
- Choose one confirmation: Add volume or a separate trend measure so CCI and the second tool answer different questions.
- Define two states: For example, sustained CCI above +100 may represent momentum continuation research, while a move back inside the central band may trigger a reversal review.
- Build the universe: Scan a list organized by centralized exchange, market-cap tier, supported category, or ecosystem.
- Review the charts: Check liquidity, volume, price structure, and timeframe before treating a result as actionable research.
The crypto screener workflow is more consistent when the input universe has already been organized and symbols have been checked. A maintained TradingView-compatible watchlist can reduce manual ticker cleanup, but it doesn't validate a strategy or guarantee that every scan result is tradable.
The strongest use of CCI is therefore operational: define the universe, scan for a state, inspect the underlying chart, and record the reason for keeping or rejecting the symbol. That process gives the indicator a job without asking it to predict the market.
TradingList provides maintained, TradingView-compatible crypto watchlists organized by supported centralized exchanges, market-cap groupings, categories, and ecosystems, along with tools for creating narrower lists and combining or comparing symbol universes. Visit TradingList to organize a cleaner crypto symbol list before applying CCI scans in TradingView.