The best crypto tools depend on the job. With the crypto market at about $2.67 trillion, Bitcoin at roughly 60.2% dominance, and Ethereum at about 11.3%, traders need more than a charting platform to organize symbols, validate market data, and investigate what moves assets.
Why choose a tool because it appears on a generic “best crypto tools” list when the actual workflow may involve exchange-specific symbols, market-cap filters, on-chain flows, fundamentals, wallet behavior, or governance research? TradingList focuses on TradingView-compatible watchlist organization, CoinGecko supports market-data validation, and the other platforms add on-chain, fundamental, behavioral, wallet, and research context. None of them should be treated as a universal winner, a signal provider, or financial advice.
The comparison below evaluates each tool by the workflow problem it solves. It also separates a generic asset ticker, such as BTC, from a venue-specific TradingView symbol such as EXCHANGE:PAIR, a distinction that matters before importing, screening, or combining crypto watchlists.
Table of Contents
- 1. TradingList
- 2. CoinGecko
- 3. Glassnode Studio
- 4. Token Terminal
- 5. Santiment
- 6. Nansen
- 7. Messari
- Top 7 Crypto Tools Comparison
- Build a Repeatable Crypto Research Stack
1. TradingList
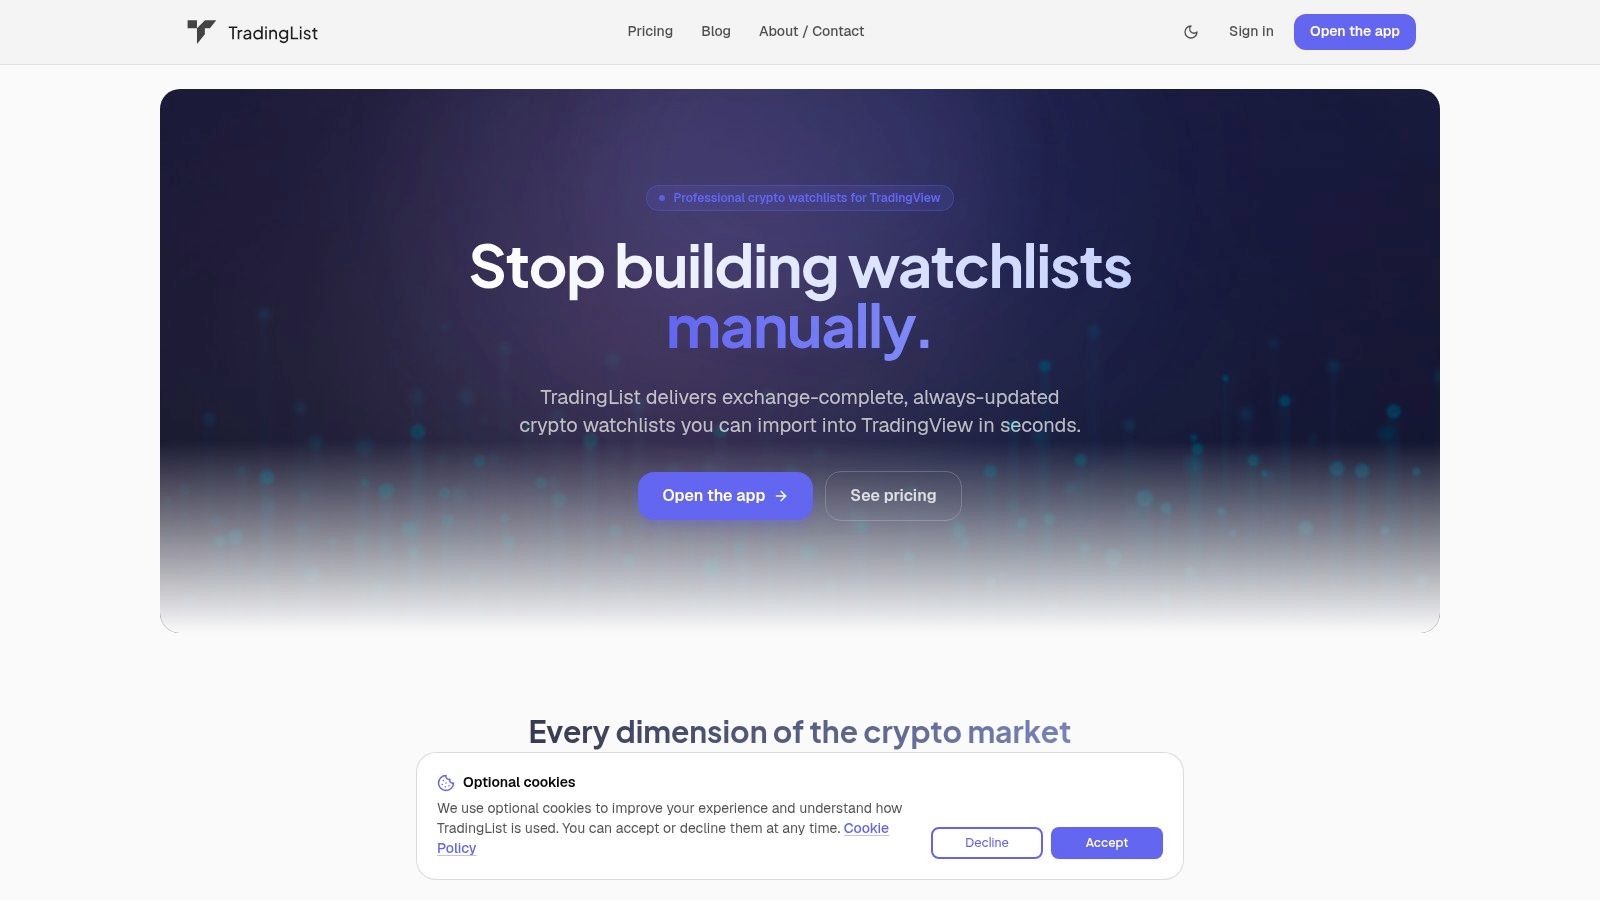
A trader can identify the assets to monitor and still lose time matching each one to the correct TradingView instrument. Exchange prefixes, quote pairs, spot markets, perpetual contracts, delistings, and naming changes all affect whether an imported list points to the intended chart. TradingView requires a .txt watchlist file with comma-separated, exchange-prefixed symbols, according to its watchlist import and export documentation.
TradingList maintains TradingView-compatible watchlists organized by centralized exchange, market capitalization, supported category, and blockchain ecosystem. The resulting universe can represent a venue, market-cap tier, sector, or ecosystem instead of a loose set of generic tickers. Its daily refresh cycle can incorporate supported listing, delisting, and naming changes when source data is available.
Practical rule:
BTCidentifies an asset concept.EXCHANGE:PAIRidentifies the TradingView instrument that a chart, alert, or screener must locate.
Where the workflow becomes useful
Standard watchlists provide maintained symbol universes. Custom crypto watchlists narrow them through supported market-cap, category, or ecosystem filters. ScreenerList creates symbol lists from market filters, DeltaList compares a reference watchlist with exchange or market variants, and FusionList combines several watchlists into one exportable configuration.
These functions reduce manual reconciliation when a trader needs like-for-like instruments with consistent quote conventions. TradingView also uses different symbol endings for spot and perpetual contracts, so exchange-prefixed crypto symbols matter during list construction.
TradingList supports direct .txt exports and automatic list splitting for TradingView's stated 1,000-symbol limit. It is a workflow and productivity tool, not an exchange, broker, trading platform, signal provider, prediction engine, portfolio adviser, or financial adviser. It does not provide DeFi watchlists.
Pros
- Ready-to-import formatting: Exchange-specific symbols reduce manual prefix and pair cleanup.
- Organized universes: Standard and custom lists support centralized exchanges, market-cap tiers, supported categories, and ecosystems.
- Comparison and combination: DeltaList and FusionList help compare or merge list configurations.
- Flexible access: Guest use, subscriptions, and one-time list purchases provide different access paths, with current pricing available on the TradingList website.
Cons
- Narrow product scope: It focuses on symbol selection, filtering, comparison, combination, and export.
- Advanced features require Premium: Exporting Custom crypto watchlists and using ScreenerList, DeltaList, and FusionList require Premium. Limited previews remain available without Premium.
- Not a research terminal: It does not replace on-chain, fundamental, behavioral, or wallet analytics.
2. CoinGecko
CoinGecko solves the market-data validation problem. A watchlist may contain a familiar ticker, but that ticker can represent different instruments across venues, or overlap with another asset's symbol. CoinGecko helps researchers inspect assets, exchanges, spot markets, DEX pools, categories, and broader market context before finalizing a TradingView-compatible universe.
Its category dashboards and filters are especially useful for sector-level review. Managed tags and category methodology add structure, although categories can change as narratives evolve and should be revisited during a regular research cycle. Alongside its portfolio features, CoinGecko's multi-chain wallet tracking supports up to 2 wallets for free users and 100 wallets for Premium users. Its developer-facing API offers paid tiers and a free demo tier; WebSocket access is available on paid Analyst plans and above.
CoinGecko's market universe illustrates why validation matters. TradingView's crypto market page showed total crypto capitalization at about $2.67 trillion on August 27, 2026, with Bitcoin near $1.61 trillion, Ethereum near $301.5 billion, and Tether USDt near $183.4 billion in market capitalization on its cryptocurrency market page. These figures show how a watchlist can be technically valid yet strategically unbalanced if it contains only the largest assets.
For analysts building a symbol workflow, CoinGecko is strongest as a market-data reference layer. It can help confirm an asset's category, compare market-cap groupings, and investigate whether a generic ticker maps to the intended project before a venue-specific symbol is imported.
Pros
- Cross-market context: Useful for validating assets across exchanges and market types.
- Category research: Filters and heatmaps support sector and narrative review.
- Developer access: API tiers support programmatic workflows; WebSocket access requires Analyst or above.
Cons
- Endpoint limitations: Exchange-specific OHLCV history can be limited for some endpoints.
- Moving categories: Narrative classifications may require periodic review.
- Not a TradingView list manager: It validates and researches assets, but it doesn't replace a purpose-built import workflow.
3. Glassnode Studio
Which workflow problem remains after a clean symbol universe is built? Glassnode Studio addresses the on-chain research layer, helping analysts examine supply dynamics, flows, profitability, cost basis, and related market metrics before adding assets to monitoring or alert workflows.
The platform combines on-chain, spot, derivatives, ETF, and macro data. Its research environment includes a Token Screener, Cost Basis Distribution, Profitability Map, dashboards, API access, CLI tools, and an Excel add-in with credit-based exports. Glassnode's published feature matrix lists coverage of 1,500+ assets, data across 11+ blockchains, history reaching 15+ years, and resolution as fast as 10 minutes on its Professional tier, as described in its Glassnode Studio product information.
Glassnode and TradingView solve different research tasks. TradingView supports charting, indicators, drawing tools, screeners, alerts, and list-based market monitoring. Glassnode focuses on network activity, holder behavior, and market-structure evidence. An effective sequence is to validate the asset and venue-specific symbol, apply on-chain filters, then move qualifying names into compatible TradingView watchlists for chart review.
That separation prevents a common workflow error: treating a generic ticker as proof of a tradable market. On-chain evidence can prioritize research, but it cannot confirm whether a symbol points to the intended asset on a particular exchange.
The principal trade-off
Glassnode suits analysts, researchers, and systematic teams that need documented metrics, historical context, and repeatable data access. Its tier structure affects the economics of that workflow. API availability, historical depth, resolution, and export quotas depend on the selected configuration. Check Glassnode's current plan details and confirm Advanced API access with the provider before subscribing, as its comparison table and FAQ currently differ on this point. Professional pricing and add-ons can become costly for heavy users. Someone who only needs exchange prices and chart alerts may be paying for analytical depth that does not fit the task.
The platform is therefore an on-chain research layer, not a simple watchlist-maintenance tool. Its value depends on whether network and holder data materially improves the candidate-selection process before chart analysis begins.
4. Token Terminal
Token Terminal solves the crypto-fundamentals problem. Instead of beginning with price action, it organizes metrics such as revenue, fees, active users, and supply-side indicators in a format that resembles public-equity analysis. That structure helps analysts compare protocols within categories or ecosystems without relying solely on narrative or chart performance.
The Pro web app supports customizable datasets and CSV or Excel export. Its Data Room provides standardized REST API and SQL access to decoded multichain data, with delivery options that include the web interface, API, and BigQuery. Public methodology and KPI documentation also matter because standardized metrics are only useful when analysts understand how each measure is defined.
For a TradingView user, Token Terminal belongs before the charting stage. A market-cap or ecosystem watchlist can provide the candidate universe, while Token Terminal can help narrow that universe through fundamental questions. For example, an analyst may separate assets associated with a supported ecosystem, then investigate which protocols have relevant usage or revenue metrics before importing the final venue-specific symbols.
The limitation is access complexity. Some advanced data products and API capabilities require custom or enterprise-style contracts, and specialized or higher-volume use cases may involve custom pricing. That can make the platform a stronger fit for professional research teams than for a casual chart review.
Pros
- Comparable KPIs: Brings a structured fundamentals lens to crypto protocols.
- Multiple delivery formats: Web, API, SQL, and BigQuery options support different teams.
- Documented methodology: KPI definitions help users interpret comparisons consistently.
Cons
- Contract complexity: Advanced products and API access may require a custom arrangement.
- Not a symbol organizer: It doesn't solve exchange-prefix cleanup or TradingView import formatting.
- Protocol focus: Its strongest use cases may not apply to every asset in a broad market-cap list.
5. Santiment
Santiment addresses a research problem that charts alone cannot solve: identifying whether social attention, network activity, or development work may help explain a market move. Through Sanbase, SanAPI, and Sansheets, it brings these behavioral signals into one workflow without treating them as proof of future performance.
Its product surfaces include a screener, Social Trends, developer-activity dashboards, custom alerts, Google Sheets access through Sansheets, and API tiers with different historical depth and call quotas. The platform covers major Layer 1 and Layer 2 networks and 2,000+ assets, according to its product materials at Santiment. API restrictions depend on the metric and plan. Free-access metrics include real-time data, while restricted API metrics have a 30-day data lag on Free and Sanbase Pro. Sanbase Max removes that lag for individual plans; business plans have their own access and history limits, as set out in Santiment's API plan comparison.
The practical workflow is selective. Start with a validated, venue-specific TradingView symbol universe, then use Santiment to filter that list by narrative intensity, social trends, or development activity. This keeps generic tickers separate from exchange symbols and prevents behavioral data from being mistaken for a complete market screen.
Santiment is most useful after charting and basic market-data filters have reduced the candidate set. Its alerts can flag changes for further review, while Sansheets suits analysts who need to compare signals outside a dedicated terminal.
Pros
- Behavioral breadth: Social, on-chain, and development data appear in one research workflow.
- Alert workflows: Custom alerts add behavioral monitoring alongside chart alerts.
- Spreadsheet access: Sansheets supports analysis in Google Sheets.
Cons
- Free-tier constraints: Restricted-metric data lag and limited filters reduce usefulness for fast-moving research.
- Plan dependency: Real-time access to restricted API metrics requires an eligible plan, such as Sanbase Max for individuals.
- Interpretation risk: Social activity provides context, not a standalone thesis.

6. Nansen
Nansen addresses the wallet and entity-intelligence problem. Market data shows whether an asset is active, while labeled wallets and flow-of-funds views help researchers examine which entities interact with an ecosystem and how capital moves across it.
Its core features include labeled wallets, Smart Money dashboards, portfolio tracking, smart alerts, multi-chain coverage, and API access billed through credits. Web and mobile access, plus builder and trading integrations, suit teams that need wallet intelligence within a broader research process. The platform is available through Nansen.
The practical workflow starts with a validated, venue-specific or ecosystem watchlist. Researchers can then use Nansen to examine wallet behavior around a smaller group of assets. This sequence keeps generic tickers separate from venue-specific instruments and prevents an address-level signal from becoming a market-wide screening metric.
Symbol validation remains a separate task. A wallet label does not identify whether a TradingView instrument represents spot trading, a perpetual contract, or the intended venue. A TradingView screener watchlist workflow helps organize and validate symbols before wallet findings are attached to the research record.
Pros
- Entity labeling: Wallet labels add context that raw addresses lack.
- Smart Money views: Flow dashboards support focused ecosystem and asset research.
- Alerts and portfolios: Useful for monitoring wallet behavior over time.
Cons
- Credit-based API access: Programmatic use can create costs beyond a web subscription.
- Trading-related fees: Fee structures depend on account tiers and underlying venue fees.
- Interpretive limits: Wallet activity is evidence for investigation, not a forecasting method.
Researchers focused on exchange prices and chart alerts are paying for depth the task does not require. Nansen fits advanced users who need to move from identifying relevant symbols to examining the wallets and entities interacting with them, after charting and symbol organization have established a clean research universe.
7. Messari
Messari solves the analyst-research problem. Its asset profiles, customizable screener, governance trackers, curated news, research reports, chartbooks, and APIs bring qualitative and quantitative work into a more structured environment.
The Asset Screener can refine watchlist candidates through filters and export capability. Governance tracking adds a dimension that price screeners often omit, while market-data, on-chain, and news APIs support teams building research systems around more than technical indicators. Messari's current Basic and Enterprise access options are described on its official plans page.
For a TradingView user, Messari is valuable at the selection and investigation stages. A researcher might begin with a supported category or ecosystem universe, use Messari to inspect asset profiles and governance events, and then export or reconstruct the resulting venue-specific symbols for charting. A crypto screener workflow can handle the separate task of turning supported market filters into a TradingView-compatible list.
Access depends on the plan. Basic provides limited access, while Enterprise expands research, filtering, and data access; additional API packages may require a separate arrangement. Check Messari's current plans for the applicable terms.
Pros
- Research depth: Combines profiles, news, governance, reports, and screening.
- Exportable filtering: Useful for narrowing candidates before chart review.
- API options: Market, on-chain, and news datasets support technical workflows.
Cons
- Plan-dependent access: Basic has limits; Enterprise and additional API packages have their own access terms.
- Coverage considerations: Researchers should compare asset coverage with other sources.
- Not an import utility: It doesn't specialize in exchange-prefix normalization or watchlist splitting.
Messari is strongest when the research question includes protocol structure, governance, or qualitative context. It shouldn't be confused with a dedicated symbol-universe manager.
Top 7 Crypto Tools Comparison
| Product | Implementation complexity | Resource requirements | Expected outcomes | Ideal use cases | Key advantages |
|---|---|---|---|---|---|
| TradingList | Low, ready-to-import .txt lists | Minimal, free guest or low-cost subscriptions / one-time purchases | Clean, TradingView-ready symbol lists; reduced setup time | Retail/pro traders, TradingView users, script authors, educators | Exchange-complete symbol sets, automatic splitting, daily refreshes (CoinGecko data) |
| CoinGecko | Low–Medium, web or API integration | Low to medium, free tier + paid API tiers; WebSocket from Analyst | Broad market data, category dashboards, ticker validation | Building/validating watchlists, sector exploration, programmatic data pulls | Wide asset/DEX coverage, category heatmaps, clear API pricing/limits |
| Glassnode Studio | Medium–High, API/enterprise integrations | Medium to high, paid tiers for high-frequency and long history | Institutional-grade on-chain and market metrics with deep history | Institutional research, validating watchlist constituents via on-chain signals | Deep historical coverage, high-resolution metrics, enterprise documentation |
| Token Terminal | Medium, web app plus API/SQL options | Medium, paid plans; some advanced products require enterprise contracts | Standardized fundamentals (revenue, fees, users) for crypto assets | Fundamental analysis, cross-protocol comparisons, financial-style KPIs | Trad-fi style KPIs, SQL/BigQuery delivery, transparent methodology |
| Santiment (Sanbase) | Medium, dashboards, API, Sheets integration | Medium, tiered API; free metrics can be real-time; restricted metrics depend on plan | Behavioral analytics combining social, dev, and on-chain signals | Narrative/sentiment analysis, alert-driven workflows, signal validation | Social + on-chain fusion, Sansheets integration, custom alerts |
| Nansen | Medium–High, dashboards, labels, API credit model | Medium to high, Pro subscription + API credits for heavy use | Wallet/entity-level flows, "Smart Money" tracking and alerts | Flow-of-funds validation, whale tracking, portfolio monitoring | Extensive wallet labeling, Smart Money dashboards, actionable wallet intelligence |
| Messari | Medium, web screener, APIs, research tools | Medium, Basic or Enterprise; additional API packages may require a separate arrangement | Analyst-grade asset profiles, screeners, governance and curated research | Professional research teams, governance tracking, in-depth asset analysis | Comprehensive research content, customizable screener, governance coverage |
Build a Repeatable Crypto Research Stack
No single platform is the best crypto tool for every stage. A TradingView-compatible watchlist answers which instruments should be monitored, market-data platforms help validate the asset universe, and specialist systems add different forms of context. Glassnode addresses on-chain structure, Token Terminal addresses fundamentals, Santiment addresses behavioral data, Nansen addresses labeled-wallet activity, and Messari addresses research, governance, and qualitative analysis.
The market itself makes organization more important. TradingView showed total crypto market capitalization near $2.67 trillion on August 27, 2026, while its global charts separated total crypto market capitalization from altcoin market capitalization, which was about $197.3 billion on that date in its global market charts. That separation demonstrates why a broad list, an altcoin list, a market-cap tier, and an ecosystem list can answer different research questions.
A repeatable workflow should verify the following before a list enters charting or screening:
- Venue-specific identity: Confirm that every symbol uses the intended
EXCHANGE:PAIRformat. - Ticker normalization: Treat a generic ticker such as
ETHseparately from the exact spot or perpetual instrument. - Source freshness: Check the provider's refresh cycle and whether listing or naming changes are supported.
- Market scope: Confirm whether the list represents a centralized exchange, market-cap tier, supported category, or ecosystem.
- Export limits: Verify the file format, comma separation, exchange prefixes, and any symbol-count limit imposed by the destination platform.
- Research separation: Keep market data, charting, fundamentals, behavioral signals, wallet intelligence, and governance evidence distinct.
TradingList is relevant when the bottleneck is symbol organization. Standard watchlists can supply maintained universes, Custom crypto watchlists can narrow supported filters, ScreenerList can build lists from market filters, DeltaList can compare a reference list with exchange or market variants, and FusionList can combine several lists into one exportable configuration. Those tools don't determine whether an asset is attractive, and their output is research context rather than financial advice.
The strongest stack is therefore modular. Market data can validate the candidates, specialist tools can investigate their context, and TradingView can remain the charting and alert workspace after the symbol universe has been checked.
TradingList provides maintained, TradingView-compatible crypto watchlists organized by centralized exchange, market capitalization, supported category, and ecosystem. Traders, researchers, educators, and advanced TradingView users can visit TradingList to explore standard lists and workflow tools for filtering, comparing, combining, and exporting supported symbol universes.