
The popular advice is that market cap tells you how big or safe a crypto asset is. That shortcut is useful only if “big” means a position on a ranked list. Market cap measures the value traders currently assign to a token's circulating equity-like supply, not adoption, revenue, team quality, decentralization, liquidity, or long-term durability.
For crypto, the working formula is current price multiplied by circulating supply, as defined by CoinMarketCap's market-cap FAQ. That makes market cap an effective sorting field. It helps a researcher decide which assets deserve attention, how to separate broad market groups, and which symbols belong in a TradingView watchlist. It doesn't decide whether an asset deserves a trade.
Table of Contents
- Why Market Cap Is a Sorting Field, Not a Score
- How Market Cap Is Calculated in Crypto
- Circulating Supply vs Fully Diluted Value
- Market Cap Tiers and How Platforms Bucket Them
- What Market Cap Does Not Tell You
- Building a TradingView Watchlist From Market Cap Tiers
- A Practical Checklist for Using Market Cap
Why Market Cap Is a Sorting Field, Not a Score
A market-cap ranking resembles a spreadsheet sort more than a report card. A librarian can arrange books by page count, publication date, or alphabetical order. That arrangement helps someone find books on the shelves, but it doesn't say which book is better. Market cap works the same way for crypto assets. It places tokens in an ordered universe according to price and circulating supply.
That distinction matters because market cap is a live estimate of currently priced equity value, not intrinsic worth. In public equities, the formula is share price multiplied by shares outstanding, and Investopedia's explanation of market capitalization emphasizes that the result is a fast comparison tool rather than a complete valuation. Crypto rankings adapt the idea by using circulating supply instead of shares outstanding.
What the number can help answer
Market cap can help a researcher answer practical questions:
Which assets are larger or smaller by current valuation? A market-cap sort creates a consistent order that price alone can't provide.
Which group deserves monitoring? A researcher can isolate larger, mid-sized, or smaller assets before applying other filters.
How should a symbol universe be organized? Market-cap tiers can become separate TradingView watchlists for broad review.
How does the market compare tokens across categories or ecosystems? A common field makes cross-group screening easier.
Practical rule: Treat market cap as a gate for attention, not a verdict on quality.
The key follow-up questions are more important than the rank itself. How much supply is circulating? How much could enter circulation later? Can the market absorb a trade? Who controls the supply? What does the project generate or support beyond a quoted price? Those questions turn a simple market-cap list into usable research.
How Market Cap Is Calculated in Crypto
Market cap is not a quality score. It is a sorting field built from two inputs:
Market cap = current token price × circulating supply
The price is the latest valuation available from trading venues or aggregated market data. Circulating supply is the number of coins considered publicly available. CoinMarketCap defines circulating supply as the best approximation of coins circulating publicly, though the method can differ across assets and data providers.
A token priced at $0.50 with 800 million coins in circulation produces this result:
$0.50 × 800 million = $400 million market cap
Compare that with a token priced at $1.20 and a circulating supply of 50 million:
$1.20 × 50 million = $60 million market cap
The cheaper token has the larger market cap because many more units are circulating. Unit price is like the price of one slice. Market cap counts the whole pie, so the number of slices changes the comparison.
The comparison in one view
| Token | Price | Circulating Supply | Market Cap |
|---|---|---|---|
| Token A | $0.50 | 800 million | $400 million |
| Token B | $1.20 | 50 million | $60 million |
A price sort can therefore put the research workflow on the wrong track. A token below a dollar is not automatically smaller than one above a dollar. Circulating units multiply the price, and that multiplication determines the asset's position in a market-cap ranking.
Where the inputs become difficult
The calculation is simple. The inputs require judgment. Aggregators combine price data from spot markets with supply information from project disclosures, blockchain records, and methodology reviews. Locked allocations, vesting reserves, burns, staking arrangements, and incomplete supply reporting can all affect what counts as circulating.
Market-cap tables use the field to create a shared order for assets. CoinMarketCap's all-coins table places market cap beside rank, price, circulating supply, and volume, showing how researchers can use it as a screening column.
That makes market cap useful for building an initial universe, not for deciding whether a token is strong. The formula answers one narrow question: what is the current price multiplied by the supply counted as circulating? It does not show how the value might change under future supply releases. That question belongs to fully diluted value.
Circulating Supply vs Fully Diluted Value
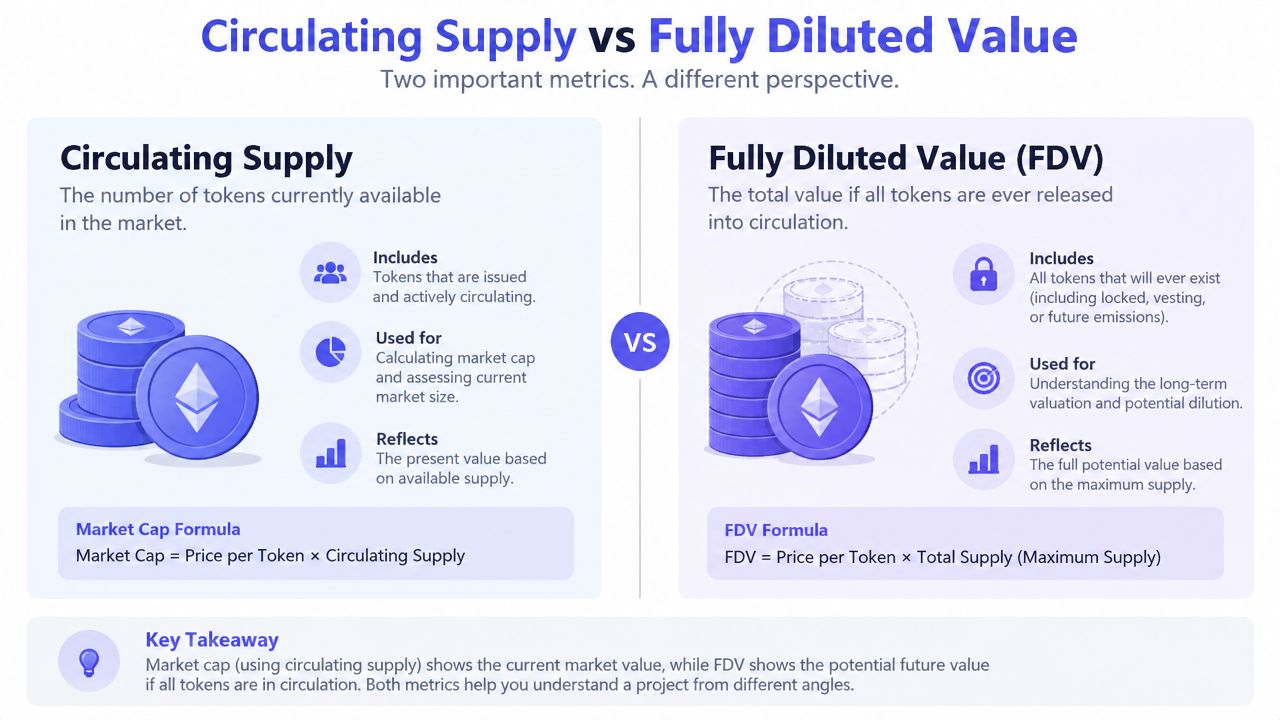
Circulating supply refers to the units counted as available for public trading. A project's broader supply can include tokens held in vesting contracts, treasury reserves, locked allocations, or future release schedules. The exact treatment depends on the project and the data provider, so researchers should inspect the supply methodology rather than assume every token has a clean figure.
Fully diluted value, commonly called FDV, extends the same price across a larger supply measure. A simple illustration uses a token trading at $2, with 100 million tokens circulating out of a 1 billion maximum supply:
Market cap: $2 × 100 million = $200 million
FDV: $2 × 1 billion = $2 billion
The figures show why the two fields can tell different stories. The circulating market cap describes the supply currently counted in public circulation. FDV describes the implied value if the full maximum supply were valued at the same price.
Why the gap matters
A large difference between market cap and FDV can signal future supply pressure. Locked tokens may become transferable later, while team, investor, or treasury allocations can enter the market according to vesting terms. CoinTracker's explanation of circulating supply describes why locked tokens, unreleased allocations, burned supply, and vesting reserves can make circulating-supply market cap materially narrower than a total-supply-based measure.
That doesn't mean FDV predicts a price outcome. It gives the researcher another lens for understanding how much supply the current price would be valuing if more tokens became available.
A market-cap sort can therefore favor assets with a small circulating float while hiding future dilution. A researcher comparing projects should place market cap and FDV side by side, then inspect the schedule before treating a ranking as meaningful.
The right field depends on the question. Circulating market cap helps answer, “How large is the currently tradable supply at this price?” FDV helps answer, “What would the broader stated supply imply at this price?” For a practical market-filter workflow, a crypto screener guide can help organize the filtering process without confusing a ranking field with a valuation conclusion.
Market Cap Tiers and How Platforms Bucket Them
Market-cap tiers are useful because they reduce a large token universe into manageable groups. They aren't universal legal categories, and platforms can use different conventions. A researcher may see a token classified differently across CoinMarketCap, CoinGecko, or an exchange-native list because each platform can apply its own thresholds, supply methodology, and refresh timing.
Common working ranges include large-cap above roughly $10 billion, mid-cap from roughly $1 billion to $10 billion, small-cap below $1 billion, and micro-cap below roughly $100 million. These are practical labels, not permanent boundaries. A token near a cutoff can move between groups as price changes or as a platform updates its supply estimate.
| Tier | Approximate Range (USD) | Common Platform Labels | Example Assets |
|---|---|---|---|
| Large-cap | Above roughly $10 billion | Large cap, major assets | Bitcoin, Ethereum |
| Mid-cap | Roughly $1 billion to $10 billion | Mid cap, established altcoins | Platform-dependent |
| Small-cap | Below roughly $1 billion | Small cap, emerging assets | Platform-dependent |
| Micro-cap | Below roughly $100 million | Micro cap, very small assets | Platform-dependent |
The example assets in the table aren't fixed classifications. Their placement can change with market price and the platform's calculation method. The useful idea is the filter, not the label.
Tiers as research filters
A large-cap watchlist can support broad market monitoring. A mid-cap list can focus attention on established projects that remain outside the largest group. A small-cap or micro-cap list can surface less mature assets, but it also demands more diligence around liquidity, supply concentration, listings, and documentation.
Academic finance uses market capitalization to separate small-cap and large-cap portfolios, and research on market capitalization and trading characteristics connects size with differences in risk, scalability, spreads, and execution quality. That doesn't turn a tier into a quality rating. It explains why the tier can influence how a trader thinks about order size and market access.
The same token can sit in one platform's mid-cap bucket while appearing near a different boundary elsewhere. For watchlist construction, the important habit is to record the source, date of the refresh, and supply basis. A blue-chip crypto watchlist can be useful for a large-asset starting universe, but the label still needs independent checks.
What Market Cap Does Not Tell You
A higher market cap doesn't automatically mean an asset is safer, stronger, more decentralized, or easier to trade. It only reflects the product of price and the supply counted in the calculation. FINRA's market-cap guidance makes the related equity distinction clear: market cap measures common equity value, not debt, cash, or the full value of an operating business.
The same limitation appears in crypto, where market cap can omit important differences between assets.
Liquidity and execution
A token can rank highly while trading thinly on the venue a researcher uses. Market cap doesn't reveal order-book depth, spread width, market concentration by venue, or how much price impact a specific order may create. A watchlist should therefore pair market-cap rank with venue-specific volume and visible liquidity.
Ownership concentration creates another blind spot. A token held mainly by a small group of wallets can behave differently from one distributed across a broad holder base. Market cap doesn't show whether large holders can influence supply, whether treasury wallets control a meaningful portion, or whether a sudden transfer could change available liquidity.
Supply and market structure
Schedules and vesting cliffs require separate research. FDV can expose the scale of a potential supply overhang, but market cap alone won't tell a researcher when tokens become transferable or who receives them.
Exchange quality also matters. A symbol listed on a venue with limited depth or inconsistent trading activity isn't equivalent to the same asset traded across deeper books. Regulatory exposure, contract controls, governance structure, security history, fee revenue, and cash-flow backing also sit outside the market-cap formula.
Consider two hypothetical assets. One has a $5 billion market cap, but 70% of its supply remains locked in a team multisig. Another has a $500 million market cap and broad distribution. The first ranks higher, yet its concentration and future token release profile may create a different drawdown risk than the second. These figures are illustrative, not claims about real projects.
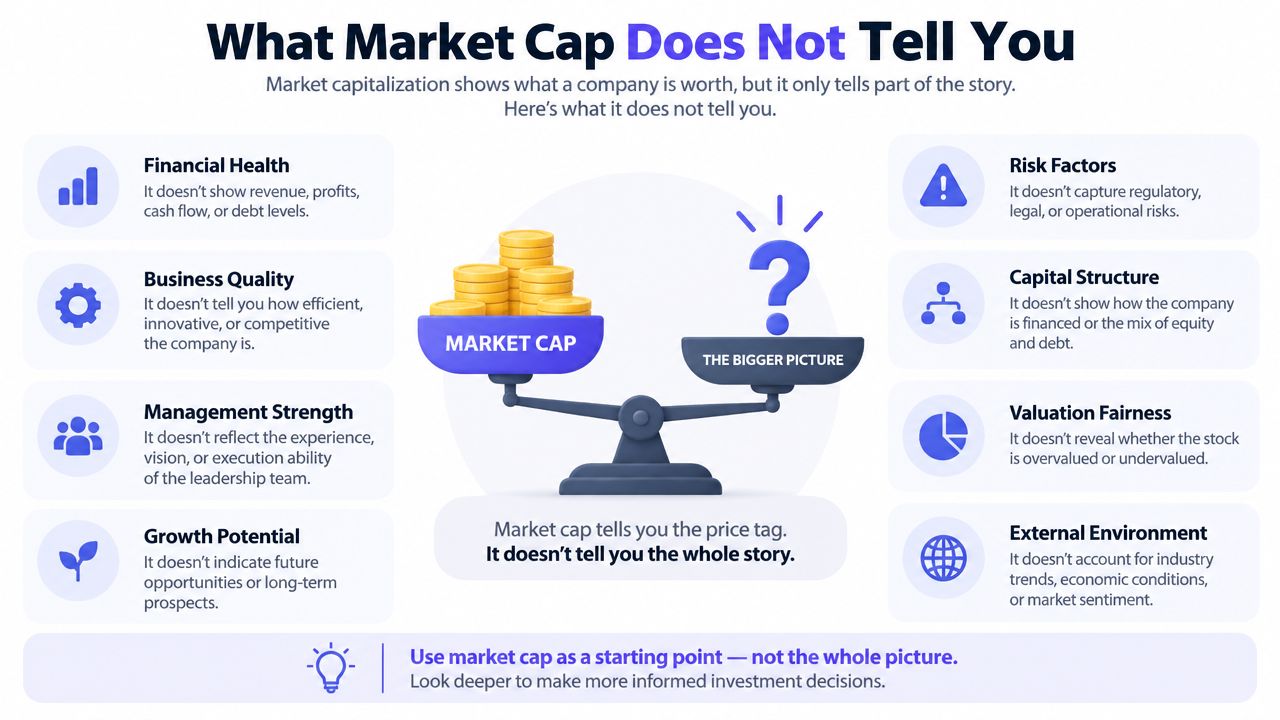
Market cap can organize the candidates. It can't perform the due diligence.
The number is still useful, but only as a snapshot. A researcher should read it alongside liquidity, distribution, venue quality, and operating or network fundamentals rather than using it as a stand-alone quality score.
Building a TradingView Watchlist From Market Cap Tiers
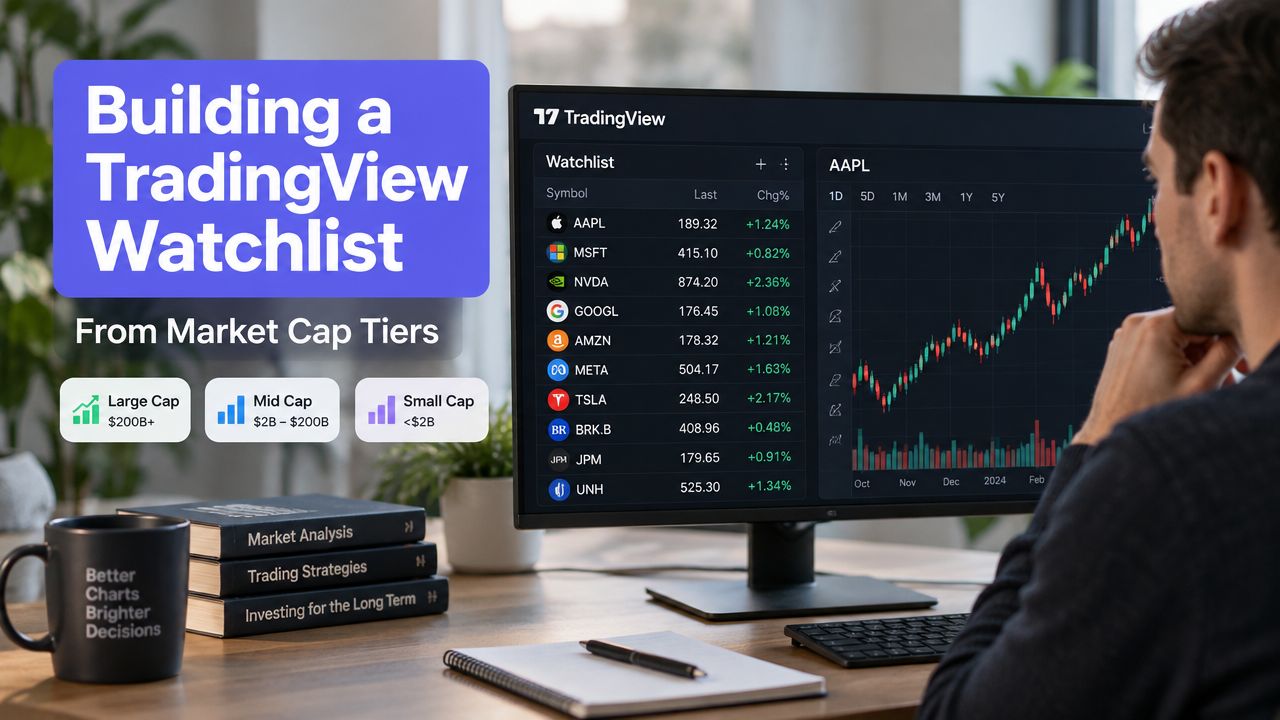
A market-cap workflow usually begins outside the charting workspace. A researcher can sort a supported asset universe by market cap on a data aggregator, select a tier or range, and then move the resulting symbols into a TradingView-compatible list. The transfer isn't complete when the tickers are copied, because a bare crypto ticker often doesn't identify the venue or quote pair.
Start with the asset universe
The first pass should define the question. A trader might want larger assets for broad market review, mid-cap assets for an altcoin scan, or smaller assets for a separate research list. Keeping those groups separate prevents a single ranked universe from mixing assets with different liquidity and execution characteristics.
The next step is symbol normalization. A generic ticker such as BTC doesn't specify whether the chart should use a spot pair, a perpetual contract, a dollar quote, or a stablecoin quote. TradingView symbols commonly use the format EXCHANGE:PAIR, so examples can include:
BINANCE:BTCUSDTCOINBASE:SOLUSDKRAKEN:ETHUSDBYBIT:PEPEUSDT
Those are venue-specific symbols, not interchangeable representations of a generic asset ticker. The researcher should confirm that the chosen exchange, pair, and market type match the intended analysis.
Build lists that preserve the filter
Separate watchlists for large-cap, mid-cap, and small-cap assets make the original market-cap logic visible during chart review. A researcher can also use color labels or naming conventions to distinguish the groups, while a custom column can keep supply or market data available for context. The TradingView layout should support comparison without implying that the tier itself proves quality.
The cleanup stage deserves as much attention as the initial sort. Duplicated tickers, unsupported pairs, exchange prefixes, quote currencies, and renamed assets can all change what appears on a chart. A practical reference on crypto symbol formatting helps explain why ticker normalization matters before import.
TradingList can support this workflow with maintained watchlists organized by centralized exchange, market cap, supported category, or ecosystem, plus narrower custom lists from supported filters. Its ScreenerList builds symbol lists from market filters, while DeltaList compares a reference list with exchange or market variants. FusionList combines several lists into one exportable configuration, making the product a symbol-organization workflow rather than a signal, prediction, broker, exchange, or adviser.
A Practical Checklist for Using Market Cap
A useful market-cap review should take the number from ranking field to research filter without turning it into a conclusion. The following sequence keeps the process compact.
Switch the sort from price to market cap. Price ranks unit cost, while market cap ranks the current price multiplied by circulating supply. This prevents a low-priced token from appearing automatically small.
Check circulating supply and FDV together. Open the supply fields and look for a large gap between current circulating value and the fully diluted figure. If the gap is wide, inspect releases before relying on the circulating rank.
Record the tier as a behavior filter. Mark the asset as large-cap, mid-cap, small-cap, or micro-cap according to the platform being used. Treat the category as a way to organize research, not as a quality grade.
Compare volume with market cap. A large valuation doesn't guarantee a deep order book. Check the relevant venue and pair for trading activity, spread, and visible depth before adding the symbol to an execution-focused list.
Scan holder concentration. Review wallet distribution, treasury balances, team allocations, and vesting information. A high rank doesn't reveal whether a small group controls a substantial share of supply.
Confirm the exact TradingView symbol. Replace bare tickers with the correct
EXCHANGE:PAIRformat, then verify the quote currency and market type.Decide whether the asset earns a watchlist slot. A market-cap ranking can nominate a symbol, but liquidity, supply structure, venue access, and research relevance should determine whether it stays.
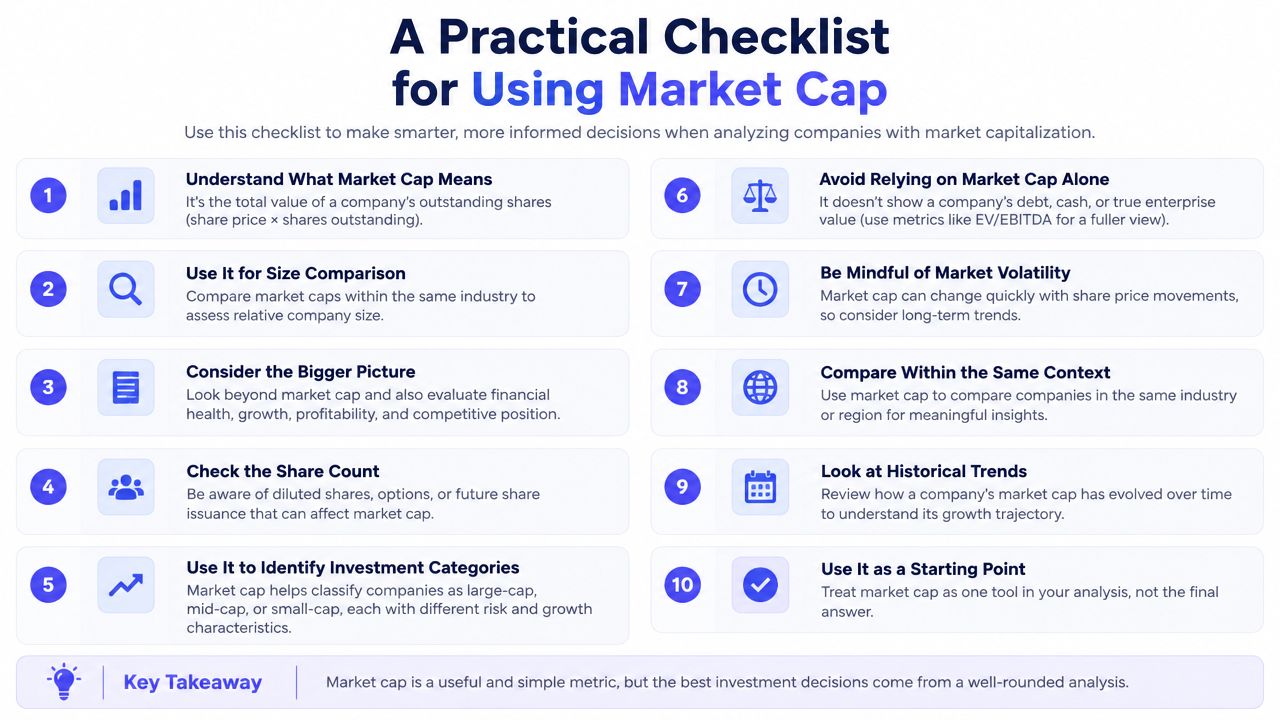
Final filter: Market cap tells a researcher where an asset sits in a sorted universe. It doesn't tell the researcher what the asset deserves.
For a TradingView workflow, TradingList offers maintained, TradingView-compatible crypto watchlists organized by supported centralized exchange, market cap, category, and ecosystem, along with custom filtering and export tools for symbol organization. Visit TradingList to review supported watchlist formats and build a market-cap-based starting universe for chart research.