Depth of market is a real-time display of pending buy and sell orders at different price levels, and it shows how much order flow the market can absorb before price moves meaningfully. In practice, a deeper book means more resistance to price impact and a more liquid market.
A crypto trader feels that gap the moment a large order hits the book and the price slips anyway, or when a seemingly thick level disappears just as entry time arrives. That's the practical value of depth of market, it turns hidden liquidity into a visible, multi-level map of supply and demand, replacing reliance on a single best bid and ask with a broader view of where execution may hold or fail as defined in market structure guidance. For traders working across venues, that difference matters because crypto liquidity is fragmented, and a single snapshot can look stronger than the actual fill quality turns out to be.
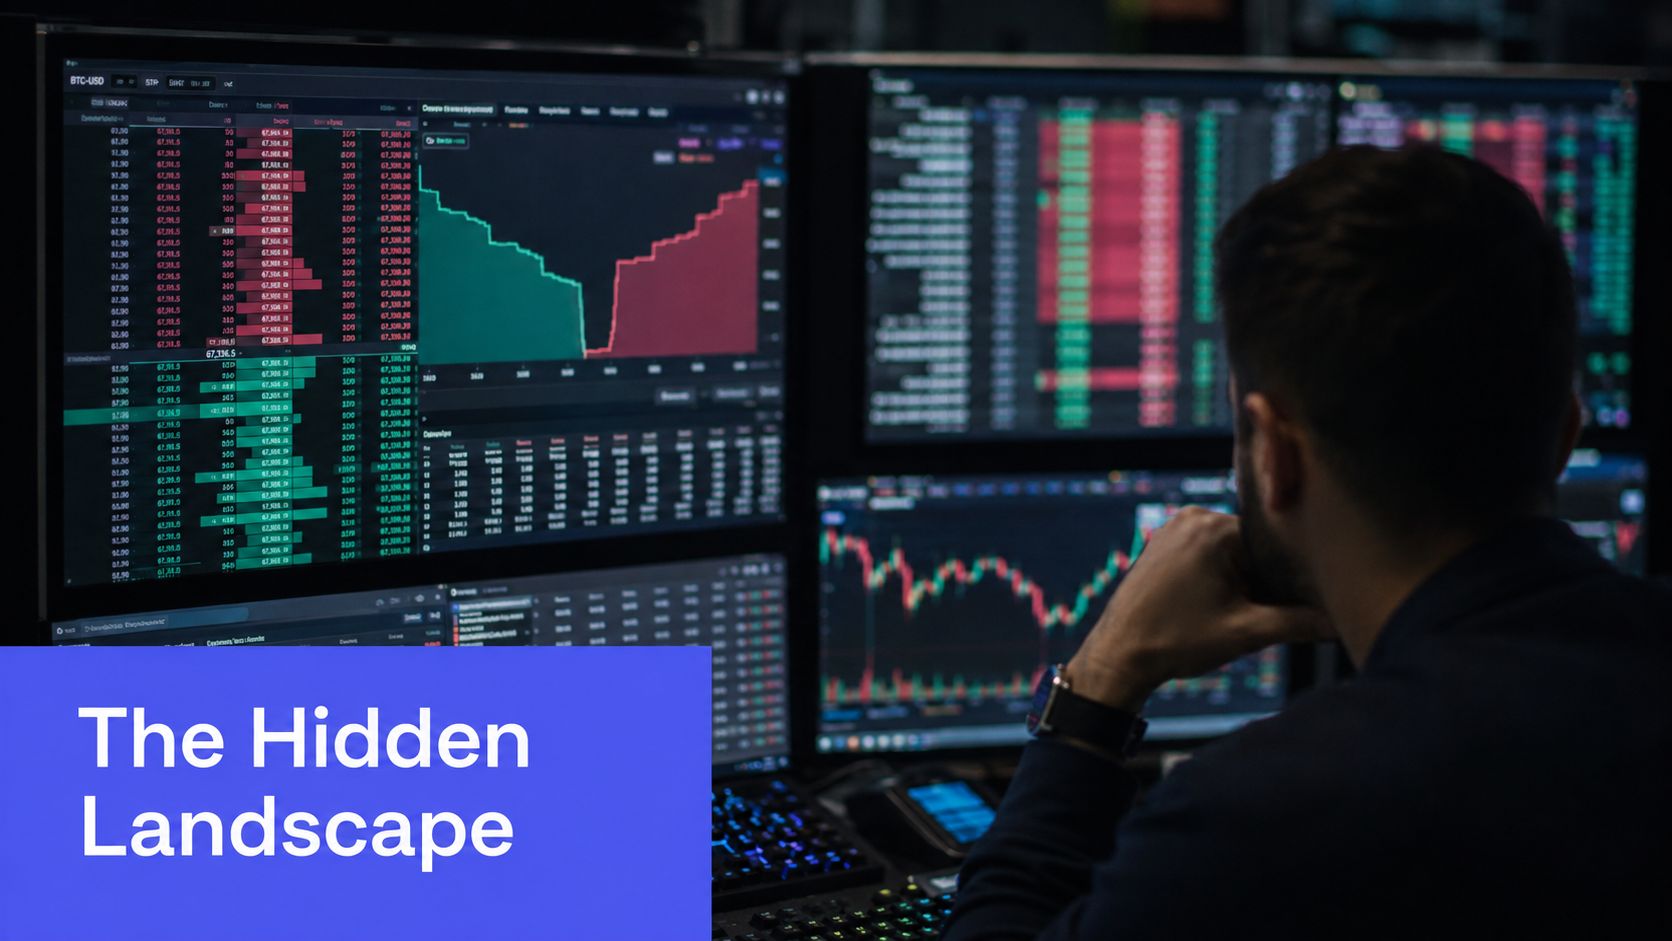
The cleanest way to think about it is simple. Depth of market, or DOM, is the order book in motion, showing visible resting interest rather than completed trades as described in the order-book definition. That makes it useful for reading current liquidity, but it also creates a trap, because visible size is not the same thing as guaranteed execution.
For traders and researchers, the right question is usually not whether DOM exists, but whether the displayed book is good enough to trust for entry, sizing, and routing. A symbol list also has to be clean before any of that analysis works, which is why many desks standardize their tickers first with a crypto ticker-symbol workflow.
Table of Contents
- Introduction to Depth of Market in Crypto
- How the Order Book Defines Market Depth
- Why Crypto DOM Requires Cross-Exchange Comparison
- Using TradingView and Exchange-Specific Watchlists
- Interpreting DOM Data for Execution Quality
- Practical Use Cases for Traders and Analysts
- Conclusion Reading Depth with Better Context
Introduction to Depth of Market in Crypto
A crypto trader can get the chart direction right and still miss the trade. A market buy that looked manageable can push through the visible book, while a limit order that seemed well placed can sit buried in the queue as price moves away. DOM sits in the middle of that problem, because it shows resting interest in real time rather than a lagging close price.
Why DOM matters before the order goes live
DOM is a live view of pending buy and sell orders across multiple price levels, and that multi-level structure is the point. It lets traders move past the best bid and ask, inspect the shape of the book, and ask a simpler question, how much size has to trade before price starts to move as explained in the DOM reference. That is why deeper books usually imply less immediate price impact, while thin books can turn routine size into slippage.
In crypto, that lens helps separate a clean-looking chart from a market that is tradable. A pair can look active on one venue and look very different on another, especially when the best-priced liquidity is scattered across exchanges. A trader who only watches one screen can mistake displayed depth for usable depth.
Practical rule: treat DOM as a liquidity map, not a promise. The book tells traders where orders are resting, but the fill still depends on queue position, spread, and whether that size stays visible long enough to matter.
Venue-specific analysis sharpens that distinction. If you are comparing pairs across screens in TradingView, the symbol universe has to stay clean, and a bad ticker format or exchange prefix can make the DOM read useless. A tidy watchlist and a consistent crypto ticker-symbol workflow save time before the actual analysis begins.
How the Order Book Defines Market Depth
A trader staring at a DOM ladder is reading two queues at once, bids on one side and asks on the other. Bids show where buyers are willing to pay, asks show where sellers are willing to offer inventory, and the spread sits between the best bid and best ask as illustrated in market-depth references. The book's shape matters just as much as any single quote, because a thick top level can still hide weak follow-through a few ticks away.
Limit orders are the core of displayed depth
DOM mainly reflects limit orders, the passive orders that rest until a market order trades into them. Market orders work the other way, they consume available liquidity immediately, which is why DOM shows intended liquidity more clearly than completed volume as noted in market-depth basics. A junior analyst should treat that as a hard distinction, because a book that looks heavy can still disappear if the size was never meant to sit there long.
Depth is the amount of order-book volume available across price levels. Deeper books can absorb larger trades with less price movement, while shallow books bend fast under size as defined in the market-depth term reference. That is why stacked liquidity, resting walls, and ladder shape carry more information than a single headline quote.
Displayed liquidity and executable liquidity are not the same thing
The book only shows what is displayed. It does not guarantee that every visible lot will still be there when your order reaches it, and it does not guarantee that the full size can trade at once. That gap is where execution problems start, especially in crypto, where cancel-heavy books and fragmented venue structure can make displayed depth look better than actual fill quality.
A thick ladder is only useful if it survives long enough for the order to hit it.
A market can also look deep on screen while execution quality remains poor. Across venues, the visible size may sit on one exchange while better pricing or cleaner fills are available on another, so a single DOM view can overstate what you can get done. Cross-exchange comparison is the practical check, because the ladder you see is venue-specific evidence, not a universal statement about the asset.
Depth is a market-structure concept, not just a screen widget. Analysts at one market-depth reference describe market depth as the amount of trading interest available at different price levels, which is the same basic idea traders use when they read a book for absorptive capacity and slippage risk. That framing keeps the focus where it belongs, on how much size the market can carry before price starts to move in a way that matters for execution.
Why Crypto DOM Requires Cross-Exchange Comparison
Crypto order books behave differently from equity books because the market is split across many venues. A single exchange can look deep in one pair and weak in another, while the best execution may require comparing several books instead of trusting the first one on screen. That fragmentation is why a DOM snapshot should be read as venue-specific evidence, not as a universal market truth.
Why one exchange can't stand in for the whole market
The main issue is that displayed liquidity is often not consolidated. A trader may see a dense ask wall on one venue, yet better-priced liquidity could be resting elsewhere, and the visible book on the first venue can overstate what is executable there. The gap between displayed size and fill quality becomes wider when venue structure is fragmented, because one clean-looking ladder does not tell you how other exchanges are priced or how much size is really available across them.
For crypto research, comparison beats assumption. The core question is not whether a pair shows depth, but which venue shows the depth, and whether that depth still holds when size arrives. That is why traders should compare books across exchanges before treating a single DOM view as meaningful, especially if they are working through a crypto pairs list and trying to separate one venue-specific market from another.
Visible size can be misleading in fast markets
Order books can change quickly, and crypto is especially prone to books that look sturdy until the first aggressive order hits them. A snapshot can overstate execution quality if liquidity is thin, if the best-priced orders are spread across venues, or if displayed size is pulled before it can be filled. The market may look orderly on screen and still produce poor fills once the order hits.
That is the practical trade-off. A trader reading DOM in crypto has to think about venue selection, symbol normalization, and liquidity fragmentation before anything else. A clean pair list helps because it keeps the exchange context intact instead of flattening every market into one generic ticker.
Using TradingView and Exchange-Specific Watchlists
TradingView is only as useful as the symbols feeding it. If the ticker format is inconsistent, or if a user mixes venues without noticing, the DOM read becomes noisy fast, because the book on one exchange isn't the book on another. For that reason, crypto analysts usually need a watchlist strategy before they need an indicator strategy.
TradingView DOM availability is separate from watchlist organization: it requires a connected broker that supports Tier 2 data, and some symbols may not display depth through the selected broker, as TradingView explains in its Level 2 data guidance.
Organizing the symbol universe first
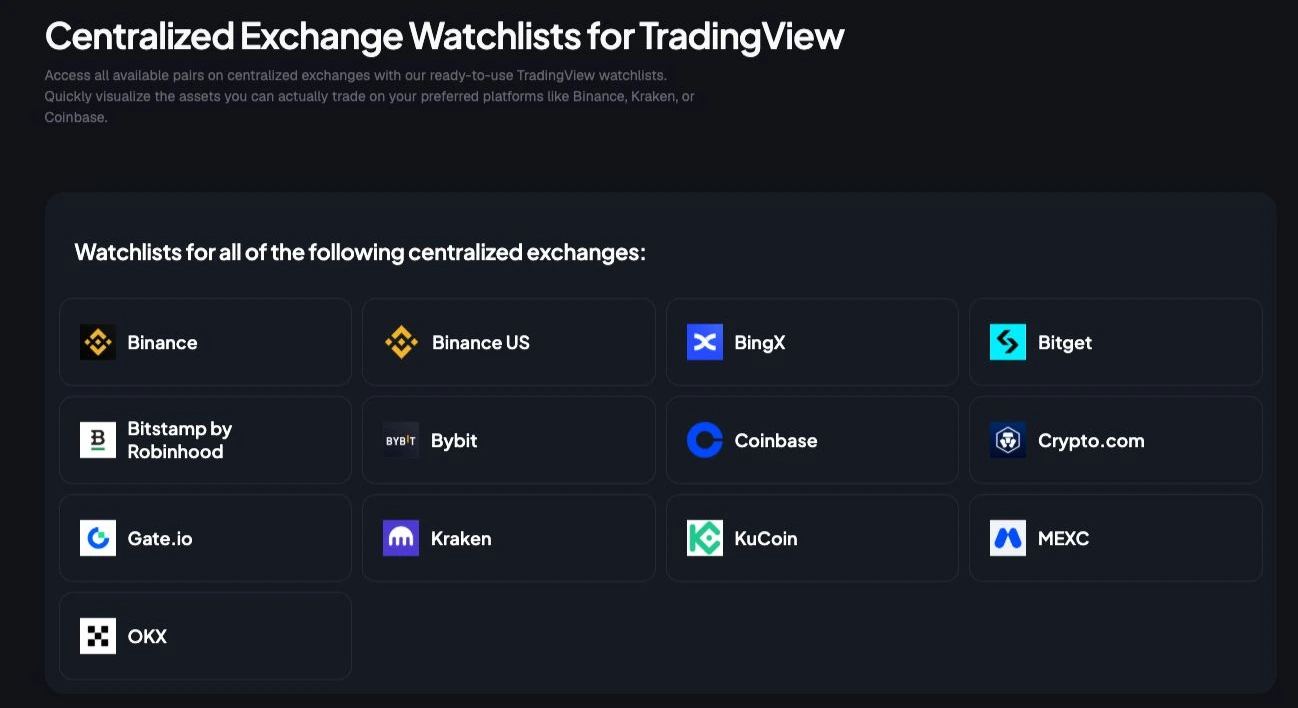
TradingView-compatible crypto watchlists help users keep venue-specific markets separate, which matters when the analysis depends on comparing liquidity across centralized exchanges. Standard watchlists can keep maintained symbol universes organized by centralized exchange, market cap, supported category, or ecosystem, while custom watchlists narrow the list further using those same filter types. That structure helps users avoid mixing symbols that should never be compared as if they were the same market.
For a DOM workflow, symbol normalization is the advantage. The distinction between a generic asset ticker and a venue-specific symbol matters, because TradingView-style formatting usually requires the exchange prefix, such as EXCHANGE:PAIR, not just the asset name. If the trader wants to compare the same coin across venues, the watchlist has to preserve that exchange context instead of flattening it away.
Why filters matter for execution review
When the symbol list is built from market filters, the analyst can compare like with like instead of scrolling through an unfocused list. A market-cap bucket, a supported category, or a specific ecosystem can all help narrow the universe to the pairs that matter for that review. That discipline makes DOM interpretation cleaner because the trader isn't asking whether the chart is mislabeled, only whether the displayed liquidity is trustworthy.
The book is easier to read when the symbols are already sorted correctly.
TradingView users who build their workflow around exchange-specific watchlists tend to spend less time fixing tickers and more time comparing the books. The workflow also becomes more stable when lists refresh on a daily cycle, because naming and listing changes are less likely to contaminate the analysis. A practical setup often starts with a TradingView screener watchlist workflow and then moves into the symbol comparisons that DOM needs.
Interpreting DOM Data for Execution Quality
DOM becomes useful when the trader reads it as a queue, not as decoration. The visible size at a price level matters, but queue position, imbalance, and whether liquidity gets pulled are what shape the actual fill. A book can look heavy on one side and still fail to protect price if the resting orders are shallow in practice or disappear under pressure.
What to watch on the ladder
Bid and ask ladders show where buyers and sellers are resting, while cumulative depth shows how quickly volume builds as price moves through levels. Imbalance highlighting is useful because it shows where one side of the book is dominating, which can help identify short-term support when buying pressure clusters below price or resistance when sell-side liquidity stacks overhead as described in the DOM execution guide. For active traders, that is execution context, not a prediction engine.
The execution logic is simple.
- Limit orders: useful when the trader wants to join the queue at a favorable price, especially if the level is likely to hold.
- Market orders: useful when speed matters more than price, but they can pay more spread and slippage if the visible book is thin or pulled.
- Imbalance signals: best used as context, because a crowded side can still disappear before the trade arrives.
How to avoid false confidence
Spoof-like behavior and cancel-heavy books are hard to separate from genuine depth by looking at a single screen. That is why traders should watch how the book behaves over several updates, not just whether a wall appears once. If a level keeps flashing and vanishing, it deserves skepticism, not respect.
The best habit is to compare displayed liquidity against execution reality. If the book shows support but price keeps slicing through it, the displayed size was never the same thing as tradable size. A market order that relies on that illusion can end up paying for the difference.
Execution quality is a behavior test. If the level doesn't hold when size arrives, it wasn't really depth, it was just displayed interest.
Practical Use Cases for Traders and Analysts
For a day trader watching a breakout, DOM adds live order-book context that the last candle alone cannot provide. DOM helps when a price level absorbs repeated sell pressure without the book collapsing, because that often tells the trader more about near-term behavior than a lagging indicator would. The useful signal is not that the wall exists, but that the wall keeps getting tested and still doesn't disappear.
One common workflow is to watch a venue-specific pair where sell-side liquidity sits above price, then see whether aggressive buyers keep lifting offers without losing momentum. If the asks keep getting absorbed and the book doesn't refill fast enough on the sell side, the trader can time the entry more carefully rather than chasing the move after the breakout is obvious. That is a cleaner read than relying only on historical support and resistance lines.
Analysts use the same logic for distribution. When large asks keep reappearing at a fixed level, the book is telling them that sellers are willing to reload there, which can cap upside and slow continuation. A clean symbol universe is what makes that observation trustworthy, because the analyst is then comparing the same venue repeatedly instead of mixing venues with different liquidity behavior.
Conclusion Reading Depth with Better Context
Depth of market works because it turns market structure into something visible, but it only works well when the trader respects what it shows. The book reveals pending interest, not guaranteed fills, and in crypto that distinction matters more because liquidity is fragmented across venues and can change faster than a single snapshot suggests. That's why a single DOM view should never be treated as the whole market.
The better habit is to combine displayed depth with disciplined symbol management. Exchange-specific watchlists, normalized tickers, and clean venue comparisons keep the analysis grounded in the right market, which is where execution quality is really decided. When the trader knows which venue is being read, the DOM becomes a practical map of supply, demand, and queue pressure instead of a misleading wall of numbers.
For crypto traders, researchers, and TradingView users who want cleaner symbol universes before they study order-book depth, TradingList provides maintained, TradingView-compatible watchlists organized by centralized exchange, market cap, supported category, and ecosystem. Visit TradingList to organize your crypto symbol workflow, compare venue-specific lists more cleanly, and keep DOM analysis tied to the right market context.