
Beta calculation is often taught like a fixed formula problem. In practice, that framing is too neat for crypto. The number changes with the benchmark, the lookback window, the sampling frequency, and even the way outliers are handled, so the core task is choosing which beta belongs to the use case.
For crypto traders and advanced TradingView users, that distinction matters. A beta used for comparison is not automatically suitable for hedging or risk review, and a benchmark choice that makes sense for one portfolio can distort another. The best way to treat beta is as a model-dependent estimate, not a permanent property of an asset.
Table of Contents
- What Beta Actually Measures in a Crypto Portfolio
- The Covariance Variance and Regression Methods
- Worked Example in Excel
- Python Example with Pandas and Statsmodels
- TradingView Workflow for Beta on Crypto Charts
- How Unstable Beta Estimates Really Are
- Crypto Specific Caveats and a Practical Workflow
What Beta Actually Measures in a Crypto Portfolio
Beta is the slope from regressing an asset's returns on a benchmark's returns. In plain terms, it answers a narrow question: how sensitive have the asset's returns been to the benchmark's returns in the selected sample? A beta around 1.0 indicates roughly one-for-one benchmark sensitivity on average, a beta above 1.0 indicates greater benchmark sensitivity, and a beta below 0 indicates an inverse fitted relationship. Beta does not measure the asset's total volatility.
Interpretation note: beta measures fitted sensitivity to a chosen benchmark, not total risk or total volatility. An asset can have a beta below 1 and still be highly volatile when its correlation with that benchmark is weak.
Why the benchmark changes the answer
The benchmark is not a neutral choice. In crypto, an altcoin measured against BTC can show a very different beta than the same coin measured against a broader market proxy or a sector basket, because the benchmark defines the return stream being explained. That is why the practical question is less “what is beta?” and more “which beta should be used here?”
Practical rule: if the benchmark changes, the interpretation changes with it.
This matters in real workflows. A trader using beta for pair selection wants a coefficient that reflects the intended hedge leg. A researcher comparing portfolio sensitivity wants a benchmark that matches the portfolio's investment universe. A risk budgeter wants something stable enough to summarize exposure without overreacting to a short burst of noise.
The same asset can also look clean in one sample and erratic in another. That is not a bug in the formula, it is a reminder that beta is estimated from history, not observed directly. The estimate inherits the structure of the sample that produced it.
Crypto makes this especially visible because assets trade continuously, react quickly, and often move in clusters. A single regression coefficient can still be useful, but only when the benchmark and sample are deliberately chosen. That is the core frame to keep in mind before any spreadsheet, script, or chart does the math.
The Covariance Variance and Regression Methods
The standard beta calculation is usually written as covariance of asset and benchmark returns divided by variance of benchmark returns. The regression version arrives at the same result when the asset return is regressed on the benchmark return with ordinary least squares assumptions. In practice, analysts often pick the form that matches their workflow, then verify it against the other.
The three equivalent views
A useful way to think about beta is through three lenses:
- Covariance and variance. This is the cleanest algebraic form, Cov(Ri, Rm) / Var(Rm).
- Regression slope. This is the same beta as the fitted line coefficient in an OLS model.
- Correlation and relative volatility. The identity Beta = Correlation × (Asset volatility / Benchmark volatility) shows how co-movement and relative volatility combine. Neither component alone determines beta.
These views are not competing methods so much as different entry points into the same coefficient. If the returns are aligned properly and standard OLS conditions hold, they converge on the same answer. That makes the calculation easier to audit, especially when a result looks odd and needs a second check in another tool.
A small numeric example
Assume five paired return observations, benchmark returns of 1, 2, -1, 0, 3 and asset returns of 2, 4, -1, 1, 5, expressed in the same units. The benchmark mean is 1 and the asset mean is 2.2. Using sample statistics, the covariance is 3.75 and the benchmark variance is 2.5. Divide the covariance by the variance and the beta is 1.5. Using population statistics instead gives covariance 3.0 and variance 2.0, which produces the same ratio.
That same coefficient appears in a regression of asset returns on benchmark returns. The fitted slope is 1.5, while the intercept captures the average return not explained by the benchmark. The point of the exercise is not the specific sample, it is showing that the spreadsheet formula and the regression output are answering the same question.
A beta that differs between methods usually points to a data alignment problem, not a philosophical disagreement.
Where practitioners stop and adjust
Once the baseline coefficient is clear, the next layer is adjustment. Adjusted beta smooths the raw estimate. Levered and unlevered beta separate capital structure effects in corporate finance contexts, which is useful when the underlying asset is not a plain spot crypto position. Those are modifications to the baseline, not substitutes for understanding the regression itself. Longer samples can reduce sampling noise, but there is no universally correct window for crypto: frequency, market regime, benchmark, and use case all matter. The corporate-finance distinction between levered and unlevered beta is explained in Wall Street Prep's guide to levered and unlevered beta; it should not be transferred mechanically to a plain spot-crypto position.
Worked Example in Excel
A clean Excel beta calculation starts with paired returns, not prices. That means two columns, one for an altcoin and one for BTC, both converted into decimal returns from closing prices. A missing row should be handled before any formula runs, because a single misaligned observation can poison the result.
A simple sheet layout
Use the returns table in rows below a header:
| Quantity | Excel Formula | Cell Inputs | Interpretation |
|---|---|---|---|
| Beta | =SLOPE(B2:B31,C2:C31) |
Altcoin returns in B2:B31, BTC returns in C2:C31 |
Slope of asset returns on benchmark returns |
| Correlation | =CORREL(B2:B31,C2:C31) |
Same return ranges | Strength of linear co-movement |
| R-squared | =RSQ(B2:B31,C2:C31) |
Same return ranges | Share of variation explained by the benchmark |
| Variance | =VAR.P(C2:C31) |
BTC returns in C2:C31 |
Dispersion of the benchmark returns |
The SLOPE function is the shortest path to beta. The CORREL function helps confirm whether the relationship is strong enough to interpret, and RSQ gives a quick read on linear fit. Microsoft lists these functions in its official Excel function reference. If the relationship is weak or visibly curved, beta may still be computed, but it becomes a rough summary rather than a dependable risk measure.
How to build the check
A scatter chart is worth the minute it takes to create. Plot the altcoin returns on the vertical axis and BTC returns on the horizontal axis, then add a linear trendline. If the points cluster loosely around a line, the beta estimate is at least visually plausible.
For the underlying series, calculate simple close-to-close returns as current price / previous price - 1. A move from 100 to 103 produces 0.03, or 3 percent. Use the same return convention and units for both the asset and benchmark; mixed units are a common source of nonsense beta outputs.
When a row is missing, don't let Excel fit the rest of the series without review. Remove the paired row or rebuild the range so both columns contain the same timestamps. The formula only works if the observations are matched.
Python Example with Pandas and Statsmodels
Python is useful when the beta calculation needs to be repeated across symbols or rolled through time. The main advantage is not exotic math, it's control over alignment, slicing, and output inspection. A small pipeline in pandas and statsmodels can produce the same coefficient as Excel, then extend it to rolling windows.
import pandas as pd
import statsmodels.api as sm
import matplotlib.pyplot as plt

df = pd.read_csv("crypto_returns.csv", parse_dates=["date"])  # Load paired return data
df = df.set_index("date").sort_index()
df = df[["asset_ret", "bench_ret"]].dropna()  # Keep matched observations only
beta_cov = df["asset_ret"].cov(df["bench_ret"]) / df["bench_ret"].var()
X = sm.add_constant(df["bench_ret"])
model = sm.OLS(df["asset_ret"], X).fit()
beta_ols = model.params["bench_ret"]
roll_60 = df["asset_ret"].rolling(60).cov(df["bench_ret"]) / df["bench_ret"].rolling(60).var()
roll_90 = df["asset_ret"].rolling(90).cov(df["bench_ret"]) / df["bench_ret"].rolling(90).var()
print("Covariance beta:", beta_cov)
print("OLS beta:", beta_ols)
plt.plot(roll_60.index, roll_60, label="60-period beta")
plt.plot(roll_90.index, roll_90, label="90-period beta")
plt.legend()
plt.show()
The key line is the paired cleanup with dropna(). If timestamps are not aligned before the two return columns are assembled, the regression can use the wrong pairs or lose observations after hidden NaNs propagate. The rolling covariance and variance operations follow the official pandas windowing documentation, while the fitted coefficient uses statsmodels OLS. That problem shows up often in crypto, where one source has gaps, another has a different timezone cut, and the benchmark series doesn't line up cleanly.
Why rolling windows matter
The rolling slice shows what fixed-window beta misses. A shorter window reacts faster but swings more, while a longer window smooths the estimate and can lag regime changes. That trade-off is exactly why many analysts test more than one window before they settle on a number.
The same logic applies to iloc slices if the data is already sorted and numbered. A batch of recent rows can be isolated, beta can be computed on that slice, and the result can be compared against the full-history coefficient. The goal is not to find the one true beta, it's to see how much the estimate depends on the sample.
TradingView Workflow for Beta on Crypto Charts
TradingView is a practical place to inspect beta because the chart already holds the return series visually. A lightweight Pine Script can pull a benchmark with request.security, compute percent change on both series, and then estimate beta from those changes on the chart. The result is not a magic number, it's a live check against the same return logic used in spreadsheet work.
A minimal Pine v5 sketch looks like this:
//@version=6
indicator("Crypto Beta", overlay=false)

benchmarkSymbol = input.symbol("BINANCE:BTCUSDT", "Benchmark")
length = input.int(60, "Lookback", minval=2)
assetReturn = (close - close[1]) / close[1]
benchmarkReturn = request.security(
    benchmarkSymbol,
    timeframe.period,
    (close - close[1]) / close[1]
)
correlation = ta.correlation(assetReturn, benchmarkReturn, length)
assetStdev = ta.stdev(assetReturn, length)
benchmarkStdev = ta.stdev(benchmarkReturn, length)
beta = benchmarkStdev != 0 ? correlation * assetStdev / benchmarkStdev : na
plot(beta, title="Beta")
This version uses the identity Beta = Correlation × (Asset standard deviation / Benchmark standard deviation) and returns na when the benchmark standard deviation is zero. TradingView's official example likewise computes close-to-close returns in the requested symbol context before applying ta.correlation(); see the Pine Script documentation for other symbols and timeframes.
The benchmark symbol should be explicit, because BTCUSDT as a ticker is not the same thing as BINANCE:BTCUSDT as a venue-specific TradingView symbol. That distinction matters when the same asset appears across multiple exchanges and the benchmark needs to match the chart source.
TradingView-compatible watchlists make the screening side easier. A preformatted universe organized by exchange or market-cap tier cuts down on manual ticker cleanup before import, which is helpful when beta has to be reviewed across many symbols rather than just one. A preformatted TradingView-compatible list can be paired with the chart work so the user is not rebuilding EXCHANGE:PAIR strings by hand every time the benchmark changes. TradingView screener watchlist workflow
A simple symbol hygiene checklist
- Use venue-specific prefixes.
BINANCE:ETHUSDTandCOINBASE:ETHUSDare different chart inputs. - Keep the benchmark fixed. Changing the benchmark mid-review turns the comparison into a moving target.
- Normalize names early. A clean symbol list saves more time than a clever script.
- Review by list, not by memory. A structured universe is easier to audit than ad hoc chart tabs.
For broader universe building, a structured symbol set is also useful when the user wants to compare beta across exchange-specific lists or market-cap buckets rather than just one chart at a time. That kind of list discipline fits naturally with crypto pairs list organization when the goal is a repeatable screen.
How Unstable Beta Estimates Really Are
Two analysts can run the same beta calculation on the same coin and end up with different answers, and neither one has to be wrong. The result shifts with the time window, the sampling frequency, the benchmark, and the way outlier sessions are handled. A short intraday sample reacts fast, but one violent move can dominate it. A longer sample is calmer, yet it can hide the current regime and make the estimate look more certain than it is.
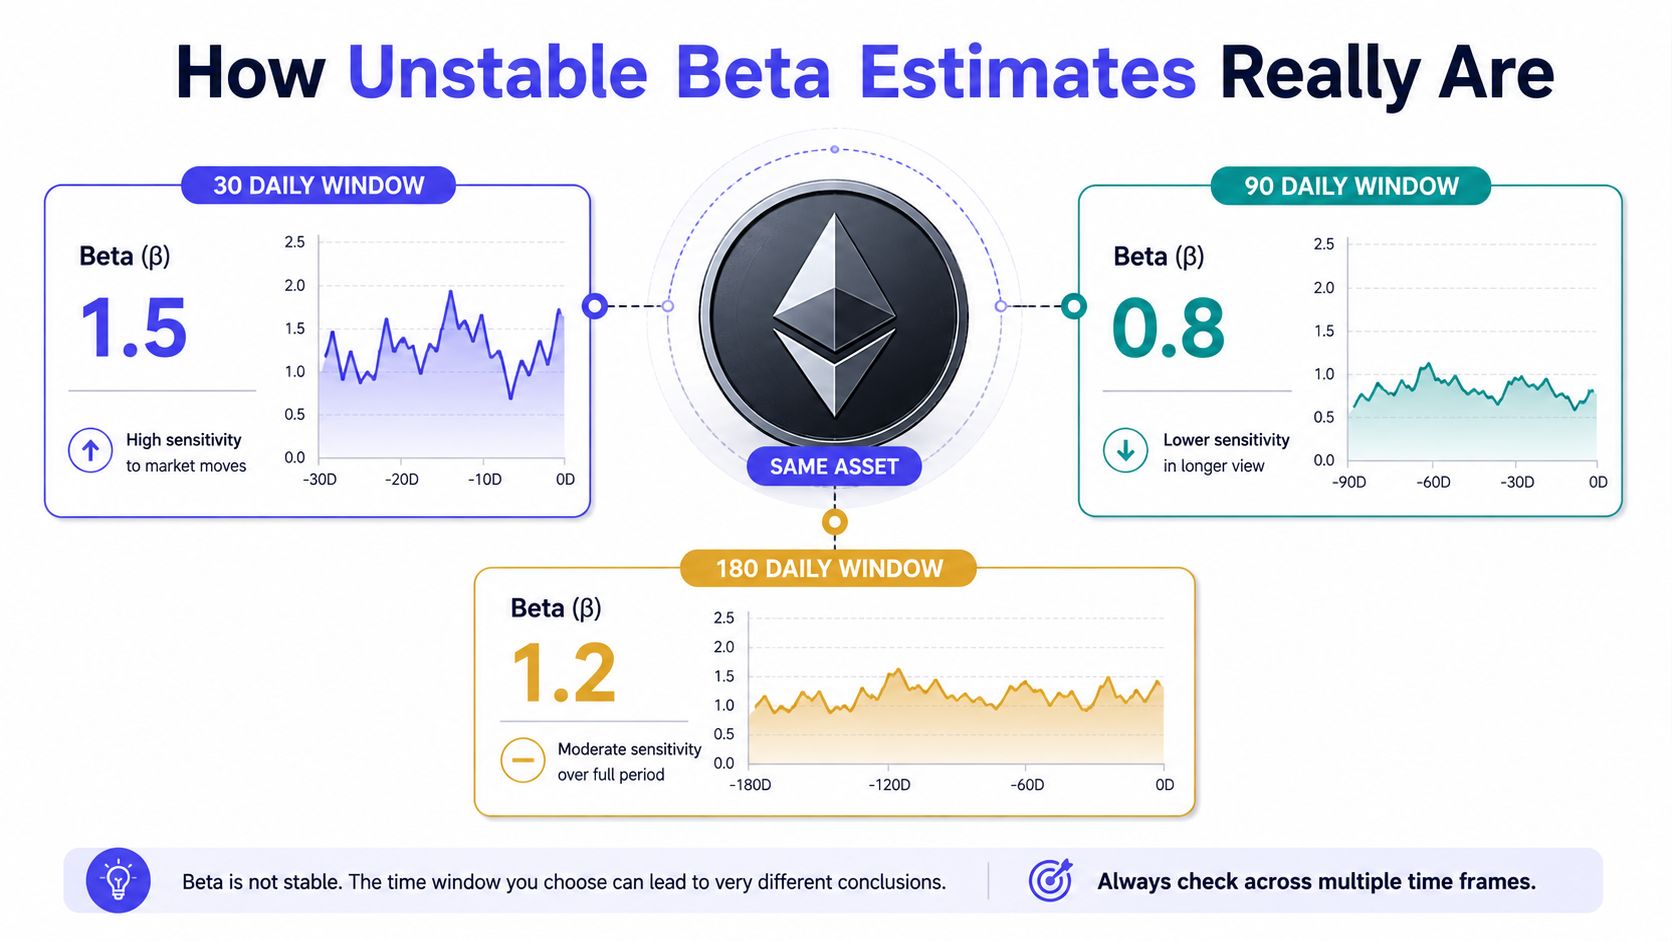
Illustrative example only: the 30-, 90-, and 180-day values in this graphic are hypothetical. They are not current Ethereum estimates and do not refer to a specific exchange, date, or benchmark.
What moves the estimate most
Switching from daily to weekly bars changes the return path before beta is even estimated, so the answer can move even if the asset itself has not changed much. Changing the lookback window does the same thing. A short sample can overreact to a single exchange event, while a longer one may spread that shock across more observations and mute it.
That is why beta should be treated as a modeling choice, not a fixed property of the coin. The benchmark, the bar frequency, and the sample length all shape the coefficient before any code is written. In crypto, that matters more than it does in slower-moving equity names because returns are noisier and regime shifts arrive faster.
The same asset can produce materially different betas when the window changes, so the number should always be reported with its inputs.
How to decide which beta to trust
A screening workflow can live with a rough estimate because the job is ranking, not precision. A hedging workflow needs closer alignment between the benchmark, the holding period, and the sampling frequency. A risk budgeter usually wants consistency over time, which favors a documented method and a stable reporting cadence.
Monthly sampling can be useful when the question is broad direction, but it is often too blunt for crypto assets that reprice quickly and trade through event clusters. Daily data gives more sensitivity, while weekly data can reduce some of the noise without flattening the series as much as monthly bars do. The trade-off is straightforward, finer frequency captures more of the action but also more of the microstructure noise, so the right choice depends on whether the beta is being used for ranking, hedging, or longer-horizon risk review.
That is why reproducibility matters more than elegance. Report the benchmark, the lookback window, and the bar frequency every time beta is presented. Without those three details, the coefficient is hard to compare and easy to misread.
Crypto Specific Caveats and a Practical Workflow
Crypto beta adds a few complications that equity textbooks don't solve well. Assets trade 24/7, while many benchmarks and traditional comparison habits are built around closed-market hours. Altcoin samples can also suffer from survivorship bias, because dead or migrated tokens disappear from many clean datasets.

Three benchmark traps that show up often
A BTC benchmark is not the same thing as a market-cap-weighted crypto index. BTC dominance tells a different story from a broad universe benchmark, and stablecoins can create structural breaks if they're treated like ordinary risk assets. Those choices matter because beta is only as relevant as the benchmark it is tied to.
Decision rule: match the benchmark to the question, not to habit.
A practical workflow starts with a clean symbol universe, then narrows it by exchange, market-cap band, supported category, or ecosystem, depending on what needs to be compared. From there, a TradingView-compatible list can be imported, reviewed on a chart, and checked against a single benchmark in a repeatable cadence. That is where a symbol-organizing tool earns its keep, especially if the analyst wants to compare exchange variants or combine several filtered lists before chart review. Crypto ticker symbol formatting guide
For recurring beta work, a structured TradingView-compatible list is more reliable than rebuilding watchlists from scratch. ScreenerList helps when the universe should come from filters, and FusionList helps when several watchlists need to be combined into one exportable set. The point is not beta automation: TradingList organizes symbol universes but does not calculate beta. Its role here is fewer symbol-formatting errors and a cleaner path from calculation to chart review.
Risk note: beta is a backward-looking linear estimate. It does not measure total risk, predict future returns, or guarantee that a hedge will work. Always report the benchmark, sample period, bar frequency, return convention, and data source with the coefficient.
TradingList provides TradingView-compatible crypto watchlists that help organize exchange-based, market-cap, category, and ecosystem symbol universes without rebuilding tickers manually. For beta calculation workflows, that kind of list discipline makes it easier to compare a benchmark against a clean symbol set and keep the setup reproducible. Visit TradingList to prepare a more consistent symbol workflow for chart review.